PSYC 1010 Chapter 2-3: 1010 psy ch2 & 3 PDF

29 Jun 2018
School
Department
Course
Professor

of 110
PSY 1010 CHAPTER 2: FREQUENCY DISTRIBUTIONS
FREQUENCY DISTRIBUTIONS:
-Basic ingredients of a data sat are called,
-Raw scores: data that have not yet been transformed or analyzed.
-We organize raw scores into,
-Frequency distribution: described the pattern of a set of numbers by
displaying a count or proportion for each possible value of a variable
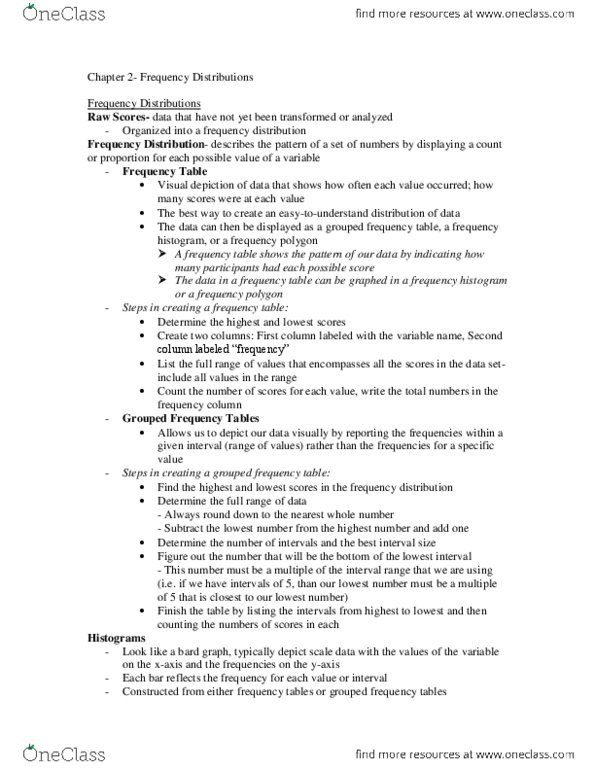
1.)FREQUENCY TABLES:
-A way of organizing data in terms of a frequency distribution,
-Frequency table: a visual depiction of data that shows how often each value
occurred, that is, how many scores were at each value
-Example: organize the data into a table with two columns, one for the range of
responses (the values) and one for the frequencies of each response (the score)
-Steps to create a frequency table:
-1.) determine highest and lowest score
-2.) create 2 column: first one variable name, second frequency
-3.) list the full range of values that encompasses all the scores in the data set, from
highest to lowest
-4.) Count the number of score at each value, and write those numbers in the
frequency column
-Finding the % for the example would be 1/80(100%) { 1= frequency,80= number of
countries}
This graph shows the frequency of the number
of countries that came in first or second in the
world cup

of 210
2.)GROUPED FREQUENCY TABLE
-What we use when there are too many decimal places (reaction time) / large ranges
(country population
-Grouped frequency table: allows researchers to depict data visually by reporting
the frequencies within a given interval rather then the frequencies for a specific value
-Five steps to generate a standard grouped frequency table:
-1.) Find highest and lowest score: {14.95 and 56.90}
-2.) Get full range( round to whole number): subtract lowest from the highest and
then add 1 {56-14=42 42+1=43} 43 is range
-3.) Determine a number of intervals and the best interval size: divide range by
number of intervals wanted { 43/9= 4.777 witch rounds to a interval size of 5}
-4.) Figure out the bottom of the lowest interval: make sure the interval starts
with a interval of 5 {ex. 5,10,15,20, etc)
-5.) Create table with intervals from highest to lowest and then counting the
number of score in each
- Example 2 shows data that aren't as easy to use for a frequency table
because of the decimals as well as a very large range of numbers
-Lowest score is 14.95, highest is 56.90
-We can report intervals or ranges of
values

of 310
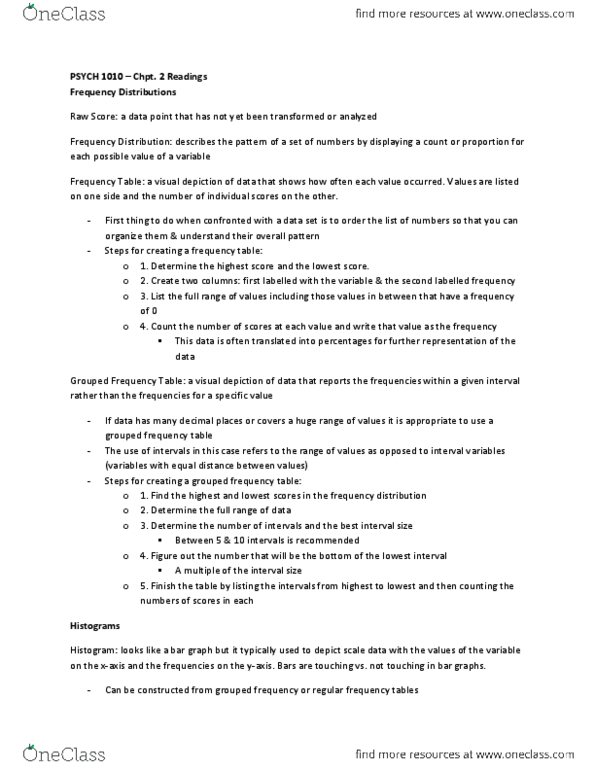
3.)HISTOGRAM
-One of the most common methods for graphing scale data (other one is frequency
polygon)
-Histogram: a graph that looks like a bar graph but depicts just one variable, usually
based on scale data, with the values of the variable on the x-axis and the frequencies
on the y-axis
-Bar graphs look at nominal data (men and women), Histograms look for one scale
variable (levels of pacing indices)
-Steps to construct a histogram from a frequency table:
-1.) Draw x-axis as variable of interest (full range for variable)
-2.) Draw y-axis as frequency ( full range)
-3.) Draw a bar for each value
- Grouping frequency tables can also be depicted as histograms. Instead of listing
values on the x-axis, we list the midpoints of intervals. {midpoint for 0-9 is 4.55555
which rounds to 5} . Determining a midpoint. look at the bottom of the interval that
you're interested in
-Steps to construct a histogram form a grouped frequency table:
-1.) determine midpoint for every interval
-2.) x-axis label with the variable of inters and withe he midpoint for each variable
-3.) y-axis lisper it as frequency, include full range
-4.) Draw bar for each midpoint
Example of Histogram derived from
frequency table
Document Summary
Basic ingredients of a data sat are called, Raw scores: data that have not yet been transformed or analyzed. Frequency distribution: described the pattern of a set of numbers by displaying a count or proportion for each possible value of a variable. A way of organizing data in terms of a frequency distribution, Frequency table: a visual depiction of data that shows how often each value occurred, that is, how many scores were at each value. Example: organize the data into a table with two columns, one for the range of responses (the values) and one for the frequencies of each response (the score) This graph shows the frequency of the number of countries that came in rst or second in the world cup. 2. ) create 2 column: first one variable name, second frequency. 3. ) list the full range of values that encompasses all the scores in the data set, from highest to lowest.