01:220:103 Lecture Notes - Lecture 16: Potential Output, Price Level, Interest Rate

4 Apr 2017
School
Department
Course
Professor
Document Summary
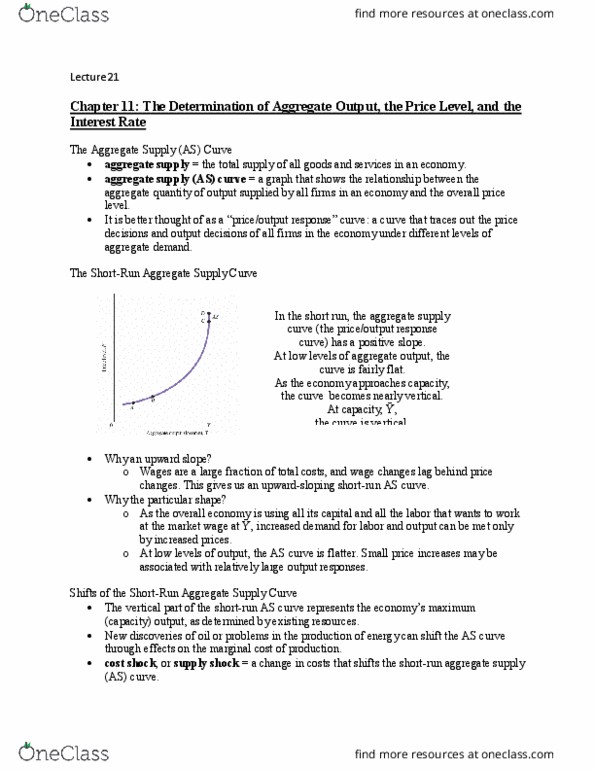
Total supply of all goods and services in an economy. A graph that shows the relationship between the aggregate quantity of output supplied by all firms in an economy and the overall price level. In the short run, (as) has a positive slope (price/output response curve) At low levels of aggregate output, curve is flat. As the economy approaches capacity, the curve becomes nearly vertical. The effects of a change in the interest rate. A high interest rate (r) discourages planned investment (i) Planned aggregate expenditure (ae) at everly level of income falls. A decrease in ae lowers the equilibrium output (income) (y) by a multiple of the initial decrease in i. Relationship between aggregate output and the interest rate in the goods market. An increase in government spending (g) with the interest rate fixed increases output (y), which shifts the is curve right. Output (y) and inflation (p) are two main inputs into the fed"s interest rate decision.