01:198:110 Lecture Notes - Lecture 12: Flowchart, Code Segment

12 Oct 2018
School
Department
Course
Professor
01:198:110 verified notes
12/28View all
Document Summary
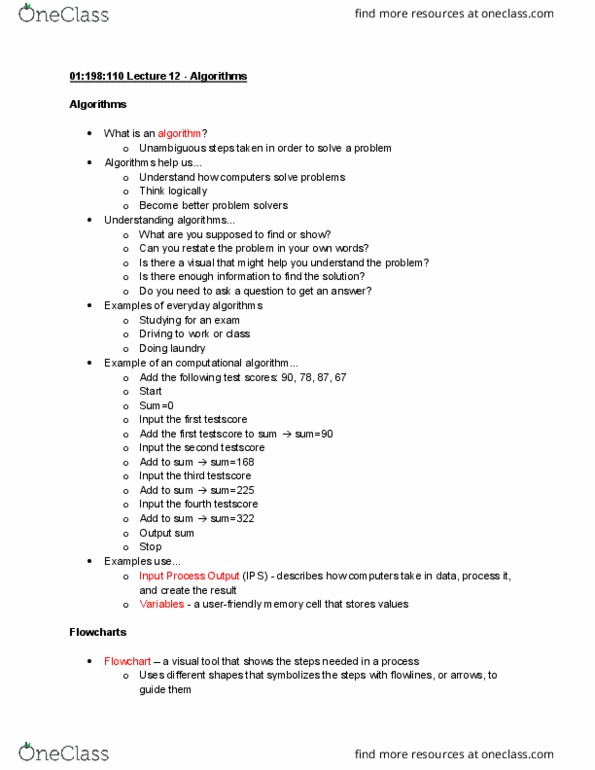
Is there enough information to find the solution: examples of everyday algorithms, studying for an exam, driving to work or class, doing laundry, example of an computational algorithm . Input the second testscore: add the following test scores: 90, 78, 87, 67, start, sum=0, add the first testscore to sum sum=90, add to sum sum=168. Input the third testscore: add to sum sum=225. Input the fourth testscore: add to sum sum=322, output sum, stop, examples use . Input process output (ips) - describes how computers take in data, process it, and create the result: variables - a user-friendly memory cell that stores values. Flowcharts: flowchart a visual tool that shows the steps needed in a process, uses different shapes that symbolizes the steps with flowlines, or arrows, to guide them, flowchart symbols (http://iyaat. org/wp-content/uploads/2018/09/audit-flowchart-symbols-unique-flowchart-symbols-meaning-visio-standard-flowchart-of-audit-flowchart-symbols. jpg) Problem solving: what to use when solving a problem .