ACCTG 211 Lecture Notes - Lecture 20: Fixed Cost, Variable Cost, Weighted Arithmetic Mean

Get access


Related Documents
Related Questions
Need help with my case study for my managerial accouting class,any help will be greatly appreciated.
Part 1 15 points
Cingle Company LLC produces gadgets at one manufacturingfactory. Corporate headquarters are located at the same site.Historical cost information shows the average costs at thefollowing production levels .
Production in units | 3,000 | 3,750 | 4,500 |
Cost of goods manufactured | |||
Direct Materials | $ 198,000 | $ 247,500 | $297,000 |
Direct Labor | 126,000 | 157,500 | 189,000 |
Overhead | |||
Building depreciation-factory | 5,000 | 5,000 | 5,000 |
Equipmentlease | 4,500 | 4,500 | 4,500 |
Factorysupplies | 1,600 | 1,930 | 2,260 |
Indirect Labor | 5,500 | 5,500 | 5,500 |
Quality InspectionCosts | 13,360 | 14,200 | 15,040 |
Selling and Administrative Expenses | |||
Shipping | 45,500 | 51,875 | 58,250 |
Advertisingexpense | 50,000 | 50,000 | 50,000 |
Salaries andcommissions | 137,000 | 155,000 | 173,000 |
Insuranceexpense | 10,000 | 10,000 | 10,000 |
Total | $ 596,460 | $ 703,005 | $ 809,550 |
A. Identify each ofthe companyâs costs as being variable, fixed or mixed with respectto the number of units produced. Explain why you chose that costbehavior. [Hint: What happens to total cost if the cost behavior isfixed, is variable, is mixed? What happens to cost / unit if costbehavior is fixed, is variable, is mixed?] Show all computationsneeded to determine cost behavior.
NOTE: If the cost is mixed, please use thechart in part B to detail your explanation.
Use the chart below:
Cost | Fixed | Variable | Mixed | Explanation |
Direct Materials | X | The total cost increases but cost/unit ($66) remainsconstant. | ||
Direct Labor | ||||
Building depreciation-factory | ||||
Equipment lease | ||||
Factory supplies | ||||
Indirect Labor | ||||
Quality Inspection Costs | ||||
Shipping | ||||
Advertising expense | ||||
Salaries and commissions | ||||
Insurance expense |
B. Using the high-lowmethod, separate each mixed cost into variable and fixed elements.State the cost formula for each mixed cost. Show all your work andcomputations.
Use the chart below:
Mixed Cost (Name) | Cost Formula (Y = a + bx form) | Supporting Computations |
C. Determine the expectedtotal costs (identify each cost separately) at a production levelof 5,000 widgets. Show computations. You should arrive at a totalcost figure.
Use the chart below:
Cost | Supporting Computations | |
Direct Materials | ||
Direct Labor | ||
Building dep-factory portion | ||
Equipment lease | ||
Factory supplies | ||
Indirect Labor | ||
Quality Inspection Costs | ||
Shipping | ||
Advertising expense | ||
Salaries and commissions | ||
Insurance expense | ||
TOTAL COST |
D. State the costequation for the total costs of the entire company in the form Y =a + bx. Using alternative one or alternative two below, show howyou determined the cost equation. (Note: you should have oneequation such that someone could determine expected total cost forany activity level within the relevant range.)
Company â Wide Cost equation:
Use the chart below (Alternative one) which shows the fixed costportion and the variable rate for each cost itemor use the high- low method (Alternative two) fordetermining the cost equation. You need to choose only onealternative.
Alternative one: (use the information and chartfrom part A and the information from part B. Input the $ amounts inappropriate columns and total the columns of the chart. Using thechart information, state the cost equation in the Y = a + bxform.)
Fixed Cost | Variable Rate ($/unit) | |
Direct Materials | ||
Direct Labor | ||
Building dep-factory portion | ||
Equipment lease | ||
Factory supplies | ||
Indirect Labor | ||
Quality Inspection Costs | ||
Shipping | ||
Advertising expense | ||
Salaries and commissions | ||
Insurance expense | ||
TOTAL COST |
Alternativetwo: High-low method and supporting, labeledcomputations.
Part Two 20 points
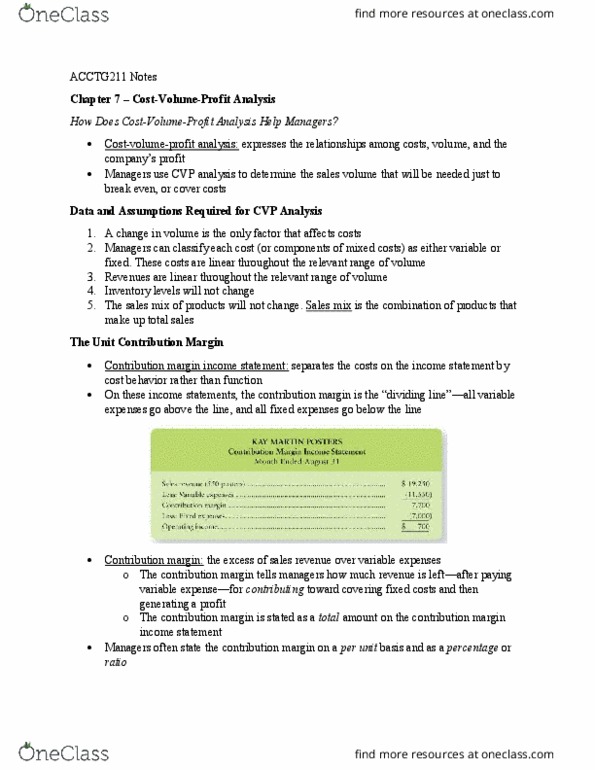
Goggle Company manufactures a special virtual reality gogglethat can be used underwater. The companyâs contribution formatincome statement for last year is below:
Total | Per Unit | % of Sales | |
Sales (10,000 units) | $750,000 | $75 | 100% |
Variable Expenses | 450,000 | 45 | ? |
Contribution Margin | 300,000 | $30 | ? |
Fixed Expenses | 170,000 | ||
Net Operating Income | $130,000 |
Goggle Company is ready to take off and expand its market share.Management has asked for several items to be analyzed in order tomake good decisions.
Calculate the companyâs contribution margin ratio and thevariable expense ratio.
Compute the companyâs break-even point in both units and insales dollars. You may use either the equation method or theformula method.
Management is predicting a 20% increase in sales next year,staying within the relevant range for the company. How much willthe companyâs net operating income increase?
Refer to the original data. Assume that management would like toearn a profit of at least $55,000. How many units will have to besold to meet this target profit?
Refer to the original data. Compute the company's margin ofsafety in both dollar and percentage form.
Compute the company's degree of operating leverage at thepresent level of sales.
Assume that through a more intense effort by the sales staff,the company's sales increase by 8% next year. By what percentagewould you expect net operating income to increase? Use the degreeof operating leverage to obtain your answer.
Verify your answer to (b) by preparing a new contribution formatincome statement showing an 8% increase in sales.
In an effort to increase sales and profits, management isconsidering the use of a higher quality virtual reality system thanthe current system. The new system would increase variable costs by$15 per unit, but management could eliminate one quality inspectorwho is paid a salary of $30,000 per year. Management believes theycan increase the selling price by $30 per unit.
Assuming that changes are made as described above, prepare aprojected contribution format income statement for next year. Showdata on a total, per unit, and percentage basis.
Compute the company's new break-even point in both units anddollars of sales. Use the formula method.
Would you recommend that the changes be made? Why or whynot?

I'll rate do not skip any parts please if you can't dodon't do at all pass it to someone else don't waste my questionthanks ( I need all answers Cost behavior, High low, contributionmargin, Sales mix, target profit Etc)
Cover-to-Cover Company is a manufacturer of shelving forbooks. The company has compiled the following cost data, and wantsyour help in determining the cost behavior. After reviewing thedata, complete requirements (1) and (2) that follow.
| Units | Total | Total | TotalMachine |
|---|---|---|---|
| Produced | Lumber Cost | Utilities Cost | Depreciation Cost |
| 13,000 shelves | $156,000 | $15,950 | $145,000 |
| 26,000 shelves | $312,000 | $30,900 | $145,000 |
| 52,000 shelves | $624,000 | $60,800 | $145,000 |
| 65,000 shelves | $780,000 | $75,750 | $145,000 |
1. Determine whether the costs in the table are variable, fixed,mixed, or none of these.
Variable Cost | Fixed Cost | Mixed Cost | None of these | ||
|---|---|---|---|---|---|
| Lumber | |||||
| Utilities | |||||
| Depreciation |
2. For each cost, determine the fixed portion of the cost, andthe per-unit variable cost. If there is no amount or an amount iszero, enter "0". Recall that, for N= Number of Units Produced,Total Costs = (Variable Cost Per Unit x N) + Fixed Cost. Completethe following table with your answers.
| Cost | Fixed Portion of Cost | Variable Portion of Cost (per Unit) |
| Lumber | ||
| Utilities | ||
| Depreciation |
High-Low
Biblio Files Company is the chief competitor of Cover-to-CoverCompany in the bookshelf business. Biblio Files is analyzing itsmanufacturing costs, and has compiled the following data for thefirst six months of the year. After reviewing the data, answerquestions (1) through (3) that follow.
| Month | Number of Units Produced | TotalCost |
|---|---|---|
| January | 4,360 | $65,600 |
| February | 250 | $6,250 |
| March | 1,000 | $15,000 |
| April | 5,250 | $56,250 |
| May | 1,750 | $32,500 |
| June | 3,015 | $48,000 |
1. From the data previously provided, help Biblio Files Companyestimate the fixed and variable portions of its total costs usingthe High-Low Method. Recall that Total Costs = (Variable Cost PerUnit x Units Produced) + Fixed Cost. Complete the followingtable.
| Total FixedCost | Variable Cost perUnit |
2. With your Total Fixed Cost and Variable Cost per Unit fromthe High-Low Method, compute the total cost for the followingvalues of N (Number of Units Produced).
| Number of UnitsProduced | TotalCosts |
| 3,500 | |
| 4,360 | |
| 5,250 |
3. Why does the total cost computed for 4,360 units not matchthe data for January in the table at the top of this panel?
The High-Low method gives accurate data only for levels ofproduction outside the relevant range.
The High-Low method gives a formula for the estimated total costand may not match levels of production other than the highest andlowest.
The High-Low method is accurate only for months in whichproduction is at full capacity.
The High-Low method only gives accurate data when fixed costsare zero.
Contribution Margin
Review the contribution margin income statements forCover-to-Cover Company and Biblio Files Company on their respectiveIncome Statements panels. Complete the following table from thedata provided in the income statements. Each company sold 84,800units during the year.
| Cover-to-Cover Company | Biblio Files Company | |
| Contribution margin ratio (percent) | ||
| Unit contribution margin | ||
| Break-even sales (units) | ||
| Break-even sales (dollars) |
Income Statement - Cover-to-Cover
Cover-to-Cover Company |
Contribution Margin Income Statement |
For the Year Ended December 31 |
1 | Sales | $424,000.00 | ||
2 | Variable costs: | |||
3 | Manufacturing | $212,000.00 | ||
4 | Selling | 21,200.00 | ||
5 | Administrative | 63,600.00 | 296,800.00 | |
6 | Contribution margin | 127,200.00 | ||
7 | Fixed Costs: | |||
8 | Manufacturing | $5,000.00 | ||
9 | Selling | 4,000.00 | ||
10 | Administrative | 54,600.00 | 63,600.00 | |
11 | Income from operations | $63,600.00 |
Income Statement - Biblio Files
Biblio Files Company |
Contribution Margin Income Statement |
For the Year Ended December 31 |
1 | Sales | $424,000.00 | ||
2 | Variable costs: | |||
3 | Manufacturing | $169,600.00 | ||
4 | Selling | 16,960.00 | ||
5 | Administrative | 33,920.00 | 220,480.00 | |
6 | Contribution margin | 203,520.00 | ||
7 | Fixed Costs: | |||
8 | Manufacturing | $121,920.00 | ||
9 | Selling | 8,000.00 | ||
10 | Administrative | 10,000.00 | 139,920.00 | |
11 | Income from operations | $63,600.00 |
Sales Mix
Biblio Files Company is making plans for its next fiscalyear, and decides to sell two new types of bookshelves, Basic andDeluxe. The company has compiled the following estimates for thenew product offerings.
| Type ofBookshelf | SalesPrice per Unit | Variable Cost per Unit |
|---|---|---|
| Basic | $5.00 | $1.75 |
| Deluxe | $9.00 | $8.10 |
The company is interested in determining how many of each typeof bookshelf would have to be sold in order to break even. If wethink of the Basic and Deluxe products as components of one overallenterprise product called âCombined,â the unit contribution marginfor the Combined product would be $2.31. Fixed costs for theupcoming year are estimated at $346,962. Recall that the totals ofall the sales mix percents must be 100%. Determine the amounts tocomplete the following table.
| Type of Bookshelf | Percent of Sales Mix | Break-Even Sales in Units | Break-Even Sales in Dollars |
| Basic | |||
| Deluxe |
Target Profit
Refer again to the income statements for Cover-to-CoverCompany and Biblio Files Company on their respective IncomeStatement panels. Note that both companies have the same sales andnet income. Answer questions (1) - (3) that follow, assuming thatall data for the coming year is the same as the current year,except for the amount of sales. If required, round answers to thenearest dollar.
1. If Cover-to-Cover Company wants to increase its profit by$40,000 in the coming year, what must their amount of sales be?
2. If Biblio Files Company wants to increase its profit by$40,000 in the coming year, what must their amount of sales be?
3. What would explain the difference between your answers for(1) and (2)?
Cover-to-Cover Companyâs contribution margin ratio is lower,meaning that itâs more efficient in its operations.
Biblio Files Company has a higher contribution margin ratio, andso more of each sales dollar is available to cover fixed costs andprovide income from operations.
The companies have goals that are not in the relevant range.
The answers are not different; each company has the samerequired sales amount for the coming year to achieve the desiredtarget profit.
Genuine Spice Inc. began operations on January 1, 2016. Thecompany produces eight-ounce bottles of hand and body lotion calledEternal Beauty. The lotion is sold wholesale in 12-bottle cases for$100 per case. There is a selling commission of $20 per case. TheJanuary direct materials, direct labor, and factory overhead costsare as follows:
| DIRECT MATERIALS | ||||
| Cost Behavior | Units per Case | Cost per Unit | Cost per Case | |
| Cream base | Variable | 100 ozs. | $0.02 | $ 2.00 |
| Natural oils | Variable | 30 ozs. | 0.30 | 9.00 |
| Bottle (8-oz.) | Variable | 12 bottles | 0.50 | 6.00 |
| $17.00 | ||||
| DIRECT LABOR | ||||
| Department | Cost Behavior | Time per Case | Labor Rate per Hour | Cost per Case |
| Mixing | Variable | 20 min | $18.00 | $6.00 |
| Filling | Variable | 5 | 14.40 | 1.20 |
| 25 min. | $7.20 | |||
| FACTORY OVERHEAD | ||
| Cost Behavior | Total Cost | |
| Utilities | Mixed | $600 |
| Facility lease | Fixed | 14,000 |
| Equipment depreciation | Fixed | 4,300 |
| Supplies | Fixed | 660 |
| $19,560 | ||
Part AâBreak-Even Analysis
The management of Genuine Spice Inc. wishes to determine thenumber of cases required to break even per month. The utilitiescost, which is part of factory overhead, is a mixed cost. Thefollowing information was gathered from the first six months ofoperation regarding this cost:
| 2016 | CaseProduction | Utility Total Cost |
|---|---|---|
| January | 500 | $600 |
| February | 800 | 660 |
| March | 1,200 | 740 |
| April | 1,100 | 720 |
| May | 950 | 690 |
| June | 1,025 | 705 |
| Required-Part A: | |
| 1. | Determine the fixed andvariable portion of the utility cost using the high-lowmethod. |
| 2. | Determine the contributionmargin per case. |
| 3. | Determine the fixed costs permonth, including the utility fixed cost from part (1). |
| 4. | Determine the break-even numberof cases per month. |
Part BâAugust Budgets
During July of the current year, the management of Genuine SpiceInc. asked the controller to prepare August manufacturing andincome statement budgets. Demand was expected to be 1,500 cases at$100 per case for August. Inventory planning information isprovided as follows:
Finished Goods Inventory:
| Cases | Cost | |
|---|---|---|
| Estimated finished goods inventory,August 1, 2016 | 300 | $12,000 |
| Desired finished goods inventory,August 31, 2016 | 175 | 7,000 |
Materials Inventory:
| CreamBase | Oils | Bottles | |
|---|---|---|---|
| (ozs.) | (ozs.) | (bottles) | |
| Estimated materials inventory,August 1, 2016 | 250 | 290 | 600 |
| Desired materials inventory, August31, 2016 | 1,000 | 360 | 240 |
There was negligible work in process inventory assumed foreither the beginning or end of the month; thus, none was assumed.In addition, there was no change in the cost per unit or estimatedunits per case operating data from January.
| Required-Part B: | |||
| 5. | Prepare the August productionbudget.* | ||
| 6. | Prepare the August directmaterials purchases budget.* | ||
| 7. | Prepare the August direct laborbudget. Round the hours required for production to the nearesthour.* | ||
| 8. | Prepare the August factoryoverhead budget. If an amount box does not require an entry, leaveit blank. (Entries of zero (0) will be cleared automatically byCNOW.)* | ||
| 9. | Prepare the August budgetedincome statement, including selling expenses. NOTE: Because you arenot required to prepare a cost of goods sold budget, the cost ofgoods sold calculations will be part of the budgeted incomestatement. *
|
Part CâAugust Variance Analysis
During September of the current year, the controller was askedto perform variance analyses for August. The January operating dataprovided the standard prices, rates, times, and quantities percase. There were 1,500 actual cases produced during August, whichwas 250 more cases than planned at the beginning of the month.Actual data for August were as follows:
Actual Direct Materials | ||
|---|---|---|
| Priceper Unit | Quantity per Case | |
| Cream base | $0.016per oz. | 102ozs. |
| Natural oils | $0.32per oz. | 31ozs. |
| Bottle (8-oz.) | $0.42per bottle | 12.5bottles |
| Actual Direct | Actual Direct Labor | |
|---|---|---|
| LaborRate | Timeper Case | |
| Mixing | $18.20 | 19.50min. |
| Filling | 14.00 | 5.60min. |
| Actual variable overhead | $305.00 |
| Normal volume | 1,600cases |
The prices of the materials were different than standard due tofluctuations in market prices. The standard quantity of materialsused per case was an ideal standard. The Mixing Department used ahigher grade labor classification during the month, thus causingthe actual labor rate to exceed standard. The Filling Departmentused a lower grade labor classification during the month, thuscausing the actual labor rate to be less than standard.
| Required-Part C: | |
| 10. | Determine and interpret thedirect materials price and quantity variances for the threematerials. |
| 11. | Determine and interpret thedirect labor rate and time variances for the two departments. Roundhours to the nearest hour. |
| 12. | Determine and interpret thefactory overhead controllable variance. |
| 13. | Determine and interpret thefactory overhead volume variance. |
