EET 300 Lecture Notes - Lecture 18: Bode Plot, Graph Paper, Frequency Response

14 Dec 2018
School
Department
Course
Professor
Document Summary
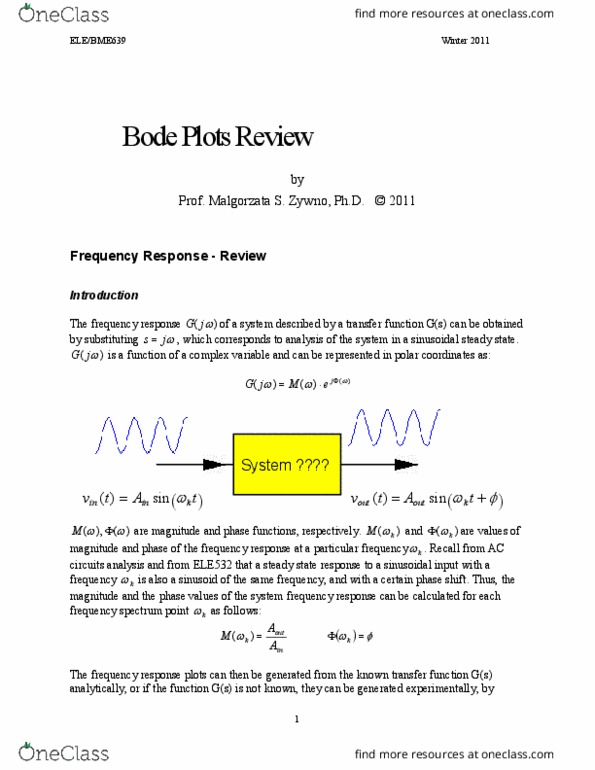
Knowledge of how to create bode plots by hand isn"t as important as it once was. It"s not that the information they provide isn"t as important, it"s that there are so many tools that will provide the actual frequency response rather than an approximation. However, it"s important to understand how the plots are constructed so that the bode plot user has a better understanding of the meaning of the information portrayed by the bode plot. Suppose you have a linear system excited by some. The linear systems transfer function is evaluated at a series of frequencies and the output amplitudes and phases are plotted vs. the frequency. s. When we evaluate the transfer function we ask how the function varies with . We can also record the phase of the function as it varies with . Once the data is obtained, it is plotted on a special type of graph paper.