MTE220 Midterm: Bode Plot Overview

1 Mar 2017
School
Department
Course
Professor
Document Summary
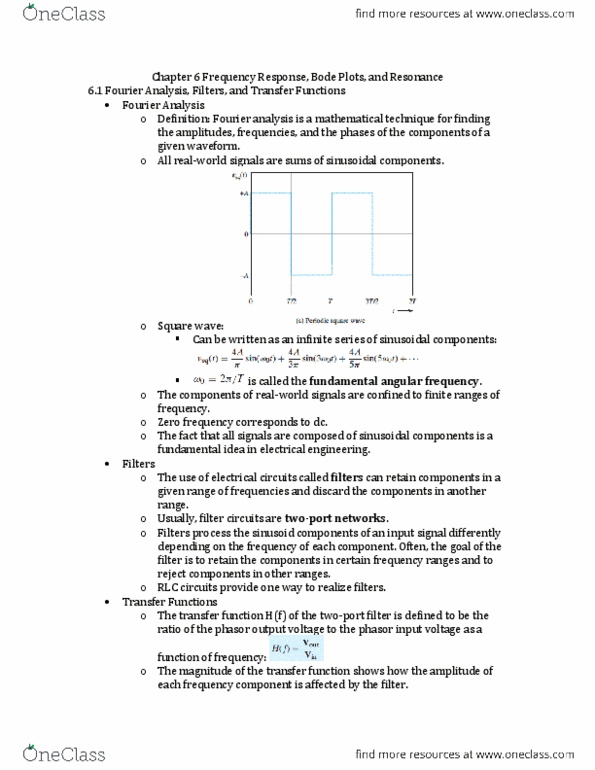
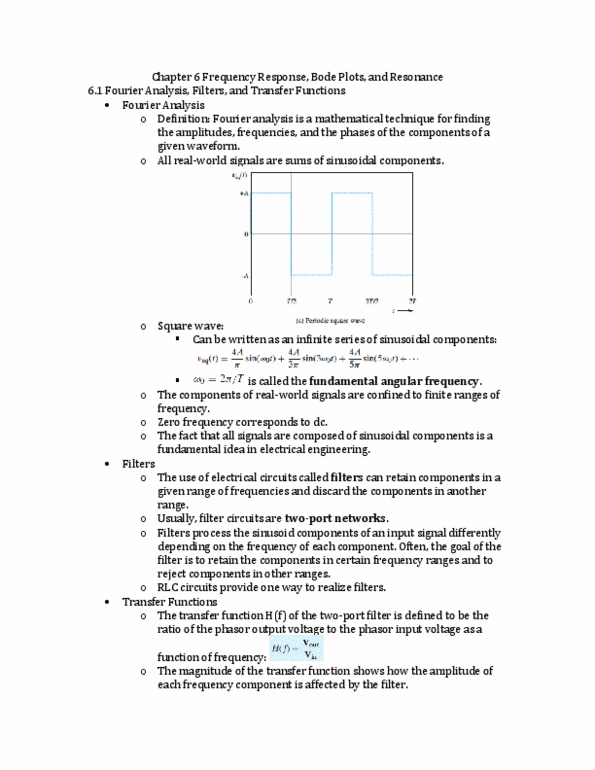
The fi(cid:396)st (cid:395)uestio(cid:374) i(cid:859)ll (cid:271)e dis(cid:272)ussi(cid:374)g is (cid:862)what is a bode plot good fo(cid:396)? (cid:863) A bode plot is a tool (in this case) for analysing a filter, and determining what effect the filter will have on different signals (will it kill them, or amplify them?). For this class, and other similar uses, it can be used for: Describing how a filter will need to behave / does behave. Making it easier to find the requirements of a filter. Finding out how a filter will interact with different signals. Finding out how the filter will react to a specific signal (sort of) In general, a bode plot describes (graphically) the response of any given system to a given signal. How much the system will amplify (or decrease) the signal. How much the system will delay the signal by. As a side (cid:374)ote, (cid:271)ode plots a(cid:396)e(cid:374)(cid:859)t li(cid:373)ited to ele(cid:272)t(cid:396)i(cid:272)al (cid:272)i(cid:396)(cid:272)uits.