STAT 1051 Lecture Notes - Lecture 20: Confidence Interval, Statistical Parameter, Point Estimation
STAT 1051 verified notes
20/30View all
Document Summary
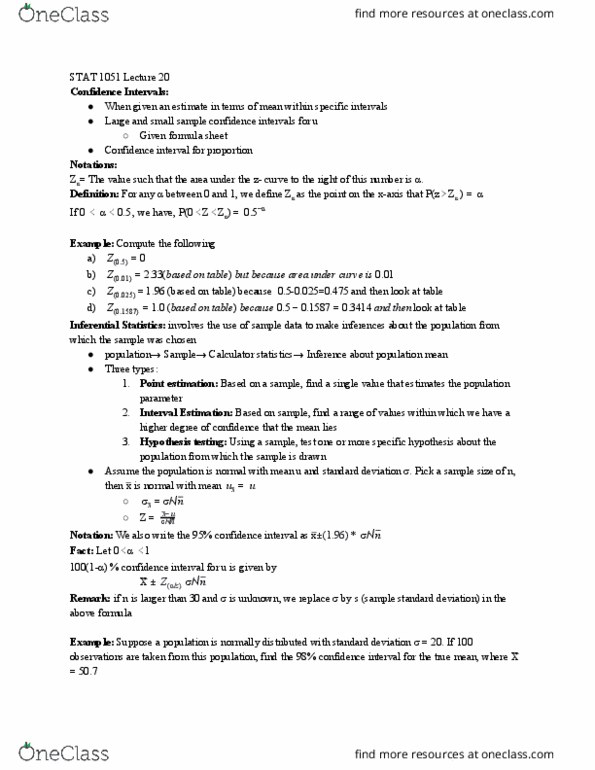
. 33(based on table) but because area under curve is 0. 01. = 1. 96 (based on table) because 0. 5-0. 025=0. 475 and then look at table. When given an estimate in terms of mean within specific intervals. Large and small sample confidence intervals for u. Z = the value such that the area under the z- curve to the right of this number is . For any between 0 and 1, we define z as the point on the x-axis that p(z z ) = . Inferential statistics: which the sample was chosen. Involves the use of sample data to make inferences about the population from. Population sample calculator statistics inference about population mean. Interval estimation: higher degree of confidence that the mean lies: hypothesis testing: . Based on a sample, find a single value that estimates the population. Based on sample, find a range of values within which we have a.


