MATH 1231 Lecture Notes - Lecture 1: Piecewise
MATH 1231 verified notes
1/5View all
Document Summary
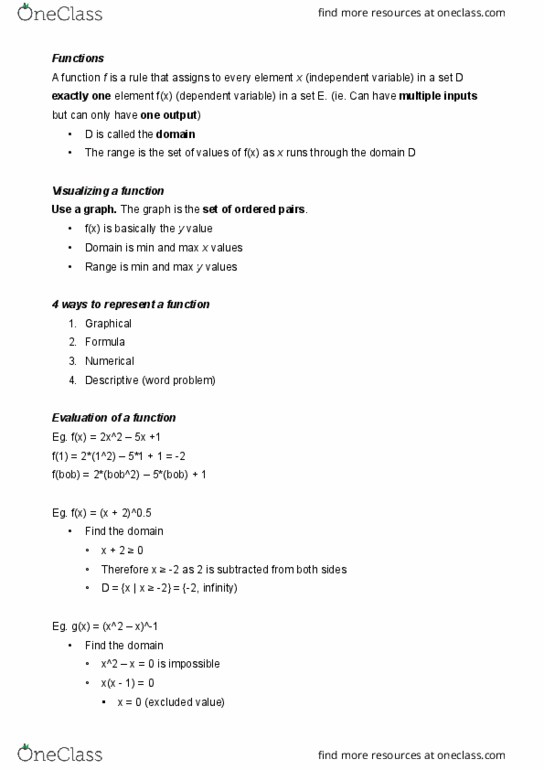
The graph is the set of ordered pairs. f(x) is basically the y value: domain is min and max x values, range is min and max y values. 4 ways to represent a function: graphical, formula, numerical, descriptive (word problem) Eg. f(x) = 2x^2 5x +1 f(1) = 2*(1^2) 5*1 + 1 = -2 f(bob) = 2*(bob^2) 5*(bob) + 1. Eg. f(x) = (x + 2)^0. 5: find the domain, x + 2 0, therefore x -2 as 2 is subtracted from both sides, d = {x | x -2} = {-2, infinity) A curve in the xy-plane is the graph of a function of x, if and only if no vertical line intersects the curve more than once. Eg. f(x) = 1 x if x -1. Therefore: f(0) = 0 f(-1) = 2 f(-2) = 3. |x| is the distance between x and 0. Therefore the value is never negative as you cannot have a negative amount of units.


