MATH 1150 Lecture Notes - Lecture 2: Unimodality, Pareto Chart, Categorical Variable

13 Mar 2017
School
Department
Course
Professor
Document Summary
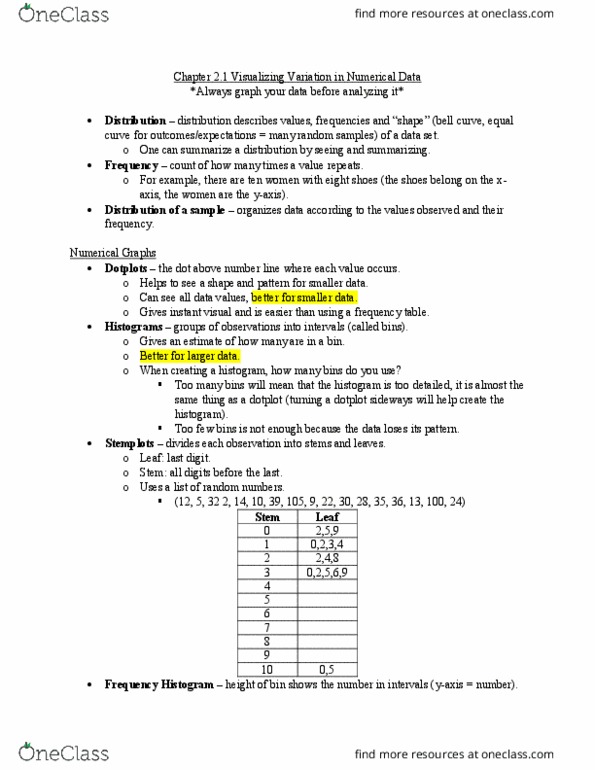
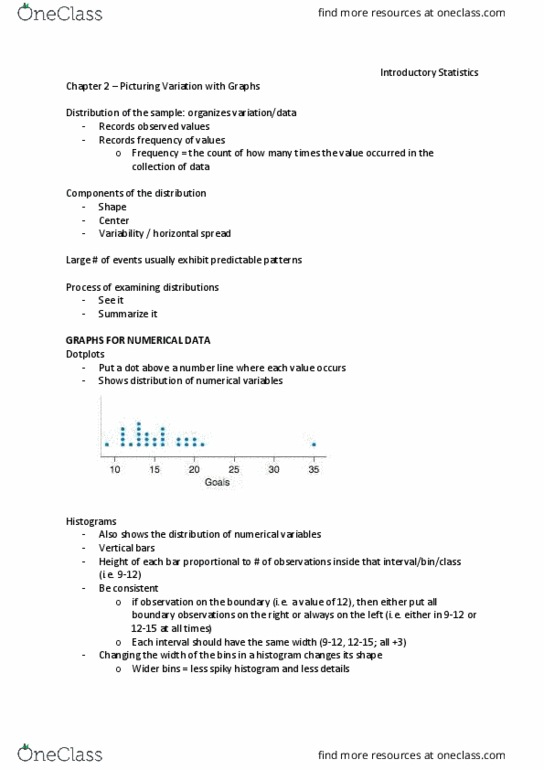
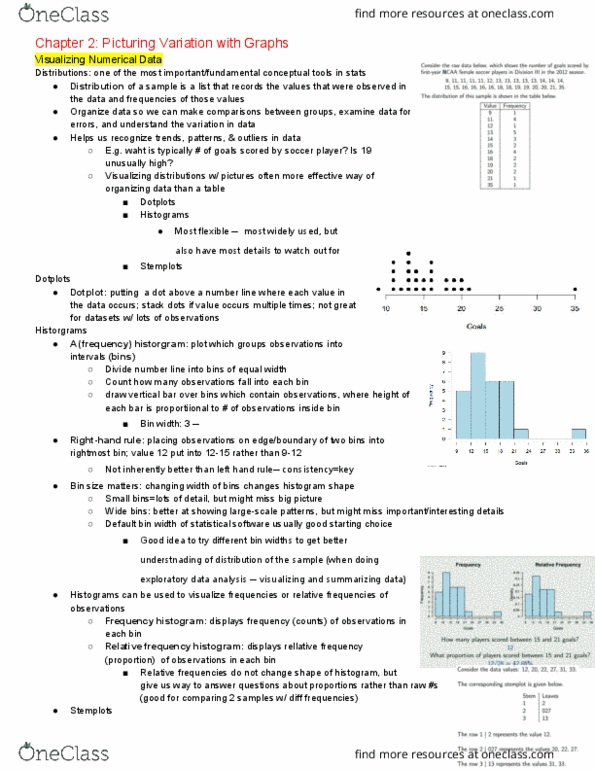
Frequency: count of how many times a value occurred. Frequency table: lists all observed data values with their counts. Dotplots: put a dot above the number line where each value occurs. Histograms: graph which groups observations into intervals called bins. Frequency histogram: how many in each interval. Stemplot: divides each observations into a stem and leaf. Symmetry: left side is roughly a mirror of the right side. Right skewed: most of the data values are small with a tail of larger values to the right. Left skewed: most of the data values are large and there"s a tail of smaller values to the left. Not typical if the distribution is skewed or bimodal. Variability: how spread out the data values are. Data far from the center: high variance. Data value that is either much larger or much smaller than the rest of the data. Bar charts: each category is represented by one bar.