Psychology 1000 Lecture Notes - Fall 2018 Lecture 3 - Informed consent, Bar chart, Histogram

21 Sep 2018
School
Department
Course
Professor

PSYCH 1000 verified notes
3/23View all
Document Summary
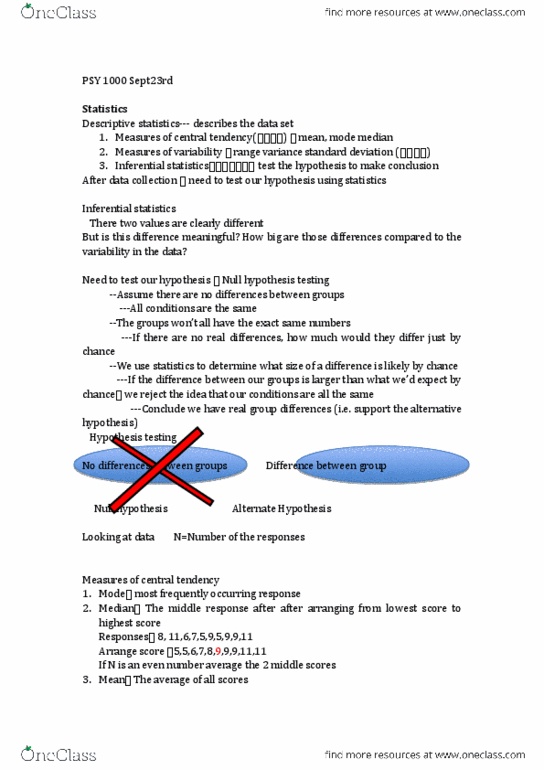
Inferential statistics: tests the hypothesis to make conclusions. The groups wont all have the exact same numbers. If there are no real differences between the groups, how much would they differ just by chance. If differences between our groups is larger than what wed expect by chance --> we reject the idea that our conditions are all the same (reject null hypothesis) Conclude we have real group differences (support alternative hypothesis) hypothesis) No difference between groups - null hypothesis (cancel it out) Frequency distribution: data written out in a chart. Median: the middle response after arranging from lowest score to highest score. Line up numbers in numerical order and find the middle number. If n is even average the 2 middle scores. Measures of variability: provide information about the spread in the scores. Variance: how much on average each score varies (or deviates) from the mean a. *mean, mode, median are equal = standard curve*