Biology 2244A/B Lecture 11: Lecture 11 – Hypothesis Testing

7 Feb 2017
School
Department
Course
Professor
Document Summary
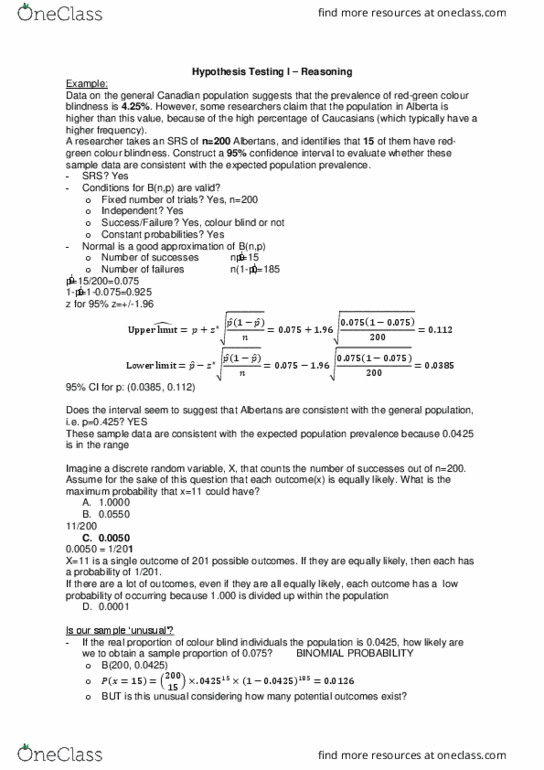
If we translate 4. 25% in the proportion it is 0. 0425. It is a plausible value for the parameter we are calculating. Can use a ci to test a clam about a population. A researcher takes an srs of n=200 albertans, and identifies that 15 of them have red-green colour blindness. Construct a 95% confidence interval to evaluate whether these sample data are consistent with the population prevalence. (0. 0381,0. 1120) (0. 0385,0. 1115) (0. 0444,0. 1056) Does the interval you constructed seem to suggest that albertans are consistent with the general canadian population, i. e. p=0. 0425: yes, no, maybe. Imagine a discrete random variable, x, that counts the number of successes out of n = 200. Assume for the sake of this question that each outcome (x) is equally likely. What is the maximum probability that x = 11 could have: 1. 0000, 0. 0550, 0. 0050, 0. 0001. What is the maximum probability that would be assigned to the outcome of x=11: 201 possible probabilities.