Biology 2244A/B Lecture Notes - Lecture 11: Cumulative Distribution Function, Random Variable, Confidence Interval

1 Jan 2017
School
Department
Course
Professor

Document Summary
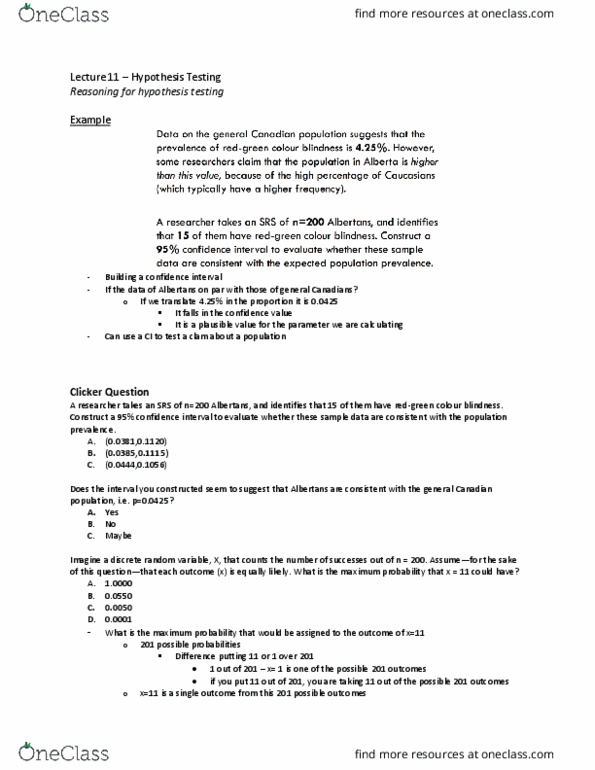
Clicker q: data on the general canadian population suggests that the prevalence of green colour blindness is 4. 25%. However, some researches claim that the population in alberta is higher than this value because of the high percentage of caucasians (which typically have a higher frequency). A researcher takes an srs of n=200 albertans and identifies that 15 of them have red-green colour blindness. Construct a 95% confidence interval to evaluate whether these sample data are consistent with the expected population prevalence. If translate 4. 25% to a proportion, 0. 0425 is in the range: plausible for the parameter we are estimating, can use a confidence interval to test a claim. If range includes the value then it is good evidence that that claim is true. Clicker q: imagine a discrete random variable, x, that counts the number of successes out of n=200. Assume for the sake of this question, that each outcome (x) is equally likely.