PSYC58H3 Lecture Notes - Lecture 2: Sphericity, Type I And Type Ii Errors, Dfs Furniture

Document Summary
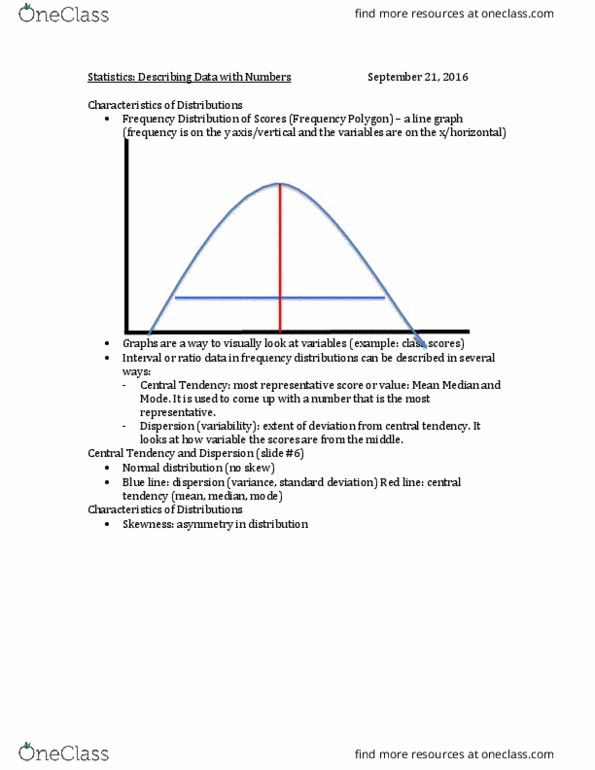
10 references not include the original scholar paper. Your hypothesis maybe this study is going to be replicated/not-replicated. Oct 4 extra tutorial hours input excel spss. Oct 25 extra tutorial hours how to calculate. This is an attempt to replicated study of . Measurements of subject responses on a variable are summarized using descriptive statistics. Histogram plots score range along x axis and score frequency along y axis. Central tendency asks what the average score is like in the distribution of scores. Median: the fiftieth percentile (half of the scores are above this score, half are below; the middle score) Variability (measures of dispersion) asks how dispersed the scores are relative to the average score. Standard deviation: how far a score deviates from the average (high standard deviation, scores are more spread out from the mean; low standard deviation, scores are closer to the mean) Ex: the salaries of the employees at dunder mifflen paper in scranton: