PSYC 2001 Lecture Notes - Lecture 5: Kurtosis, Normal Distribution, Skewness

24 Oct 2016
School
Department
Course
Professor
Document Summary
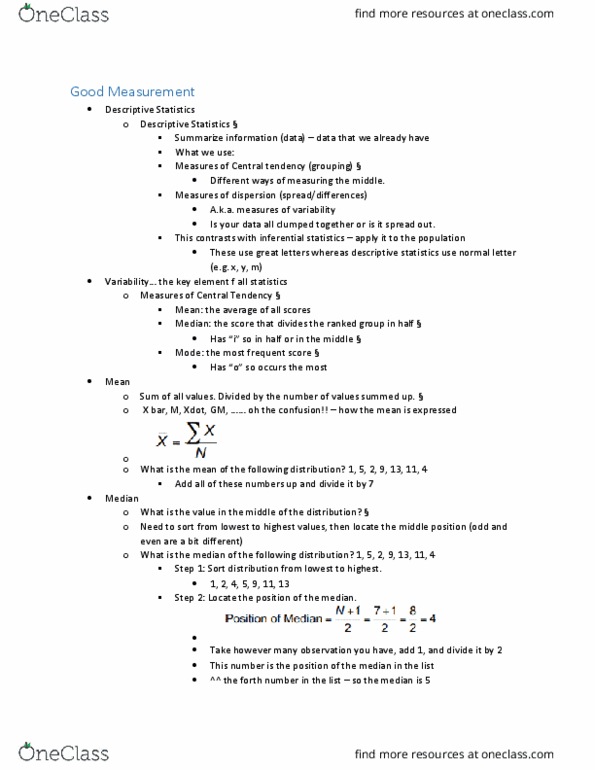
September 21, 2016 (frequency is on the y axis/vertical and the variables are on the x/horizontal) Frequency distribution of scores (frequency polygon) a line graph. Graphs are a way to visually look at variables (example: class scores) Interval or ratio data in frequency distributions can be described in several ways: Central tendency: most representative score or value: mean median and. It is used to come up with a number that is the most representative. Dispersion (variability): extent of deviation from central tendency. It looks at how variable the scores are from the middle. Blue line: dispersion (variance, standard deviation) red line: central tendency (mean, median, mode) Positive skew low tail in + direction (most grades are lower) Negative skew long tail in direction (most grades are higher) Kurtosis: peakedness of distribution and (cid:498)heaviness(cid:499) of the tails (bottom 5- Statistical notion is a shorthand for dealing with numbers. N = number of observations (or participants or values)