SOC222H5 Lecture Notes - Lecture 9: Outliner, Scatter Plot, Statistical Inference

Document Summary
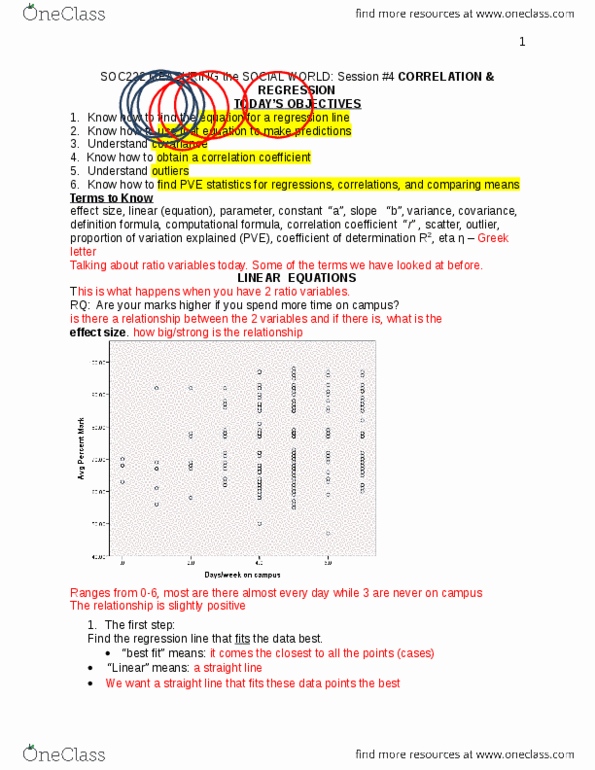
How to eliminate the effects of outliers using spss select cases. Roles of residuals and least squares in getting a regression line. How to get inferential statistics for slopes, regression model, and correlation. How to test for the linearity and the equality of variance assumptions. R2 dispersion degree of association coefficient of determination multiple regression residual prediction errors outlier least squares linearity equality of variance. Iv: urbanization percent of residents living in cities: dv: percent of residents who are immigrants. ****graphs-> chart builder-> scatter plot-> pick one and drag it up, dv- goes on y-axis-. Then hit ok and it gives you scatter plot. Eye-balling the plot suggests three things: there seems to be a positive relationship because as one goes up the other goes up. 2. relationship is not a straight line: there seem to be some extreme cases, the first lonely one, and last lonely ones.