SOC222H5 Lecture Notes - Lecture 4: Coefficient Of Determination, Contingency Table, Scatter Plot

Document Summary
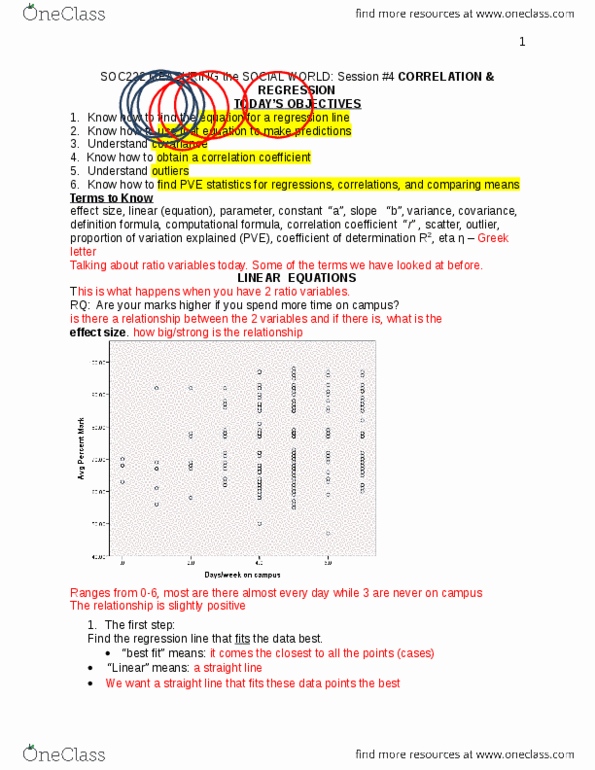
Is the relationship negative or positive: how strong the relationship is. Rq: do immigrants settle in provinces, which are more urban: percent of provincial population living in cities, percent of provincial population who are immigrants. Substantial effect size (big difference in the minimum and maximum) There is a positive relationship, as the percent immigrants increases so does the percent in cities. Regression fit line (the line of best fit) Gives us two things: the effect size how steep the slope is, the steeper the slope, the greater the effect. The steeper the slope the more the dependent variable is increasing with every 1 percent added to the independent variable: we get to see the direction of the relationship, upward sloping line. A downward sloping line tells us that the relationship is negative. Any straight line on the graph can be presented by the equation. The y is the dependent variable and the x is the independent variable.