STAT 200 Lecture Notes - Lecture 2: Marginal Distribution, Contingency Table, Unimodality

STAT 200 verified notes
2/3View all
Document Summary
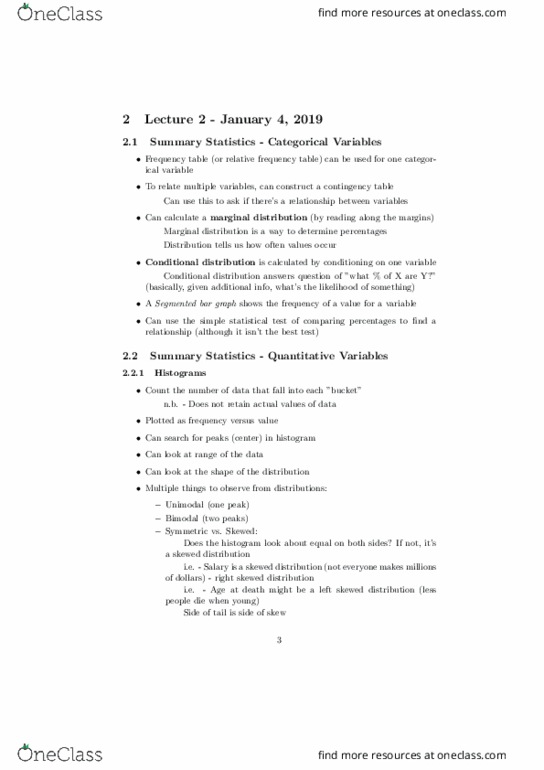
2. 1 summary statistics - categorical variables: frequency table (or relative frequency table) can be used for one categor- ical variable, to relate multiple variables, can construct a contingency table. Can use this to ask if there"s a relationship between variables: can calculate a marginal distribution (by reading along the margins) Marginal distribution is a way to determine percentages. Distribution tells us how often values occur: conditional distribution is calculated by conditioning on one variable. 2. 2. 1 histograms: count the number of data that fall into each bucket n. b. If not, it"s a skewed distribution i. e. - salary is a skewed distribution (not everyone makes millions of dollars) - right skewed distribution i. e. - age at death might be a left skewed distribution (less people die when young) 2. 2. 2 stem and leaf display: better for a small amount of data, provides actual values.