STAT 2230 Lecture Notes - Lecture 5: Probability Distribution, Standard Deviation, Normal Distribution

17 Dec 2015
School
Department
Course
Professor
Document Summary
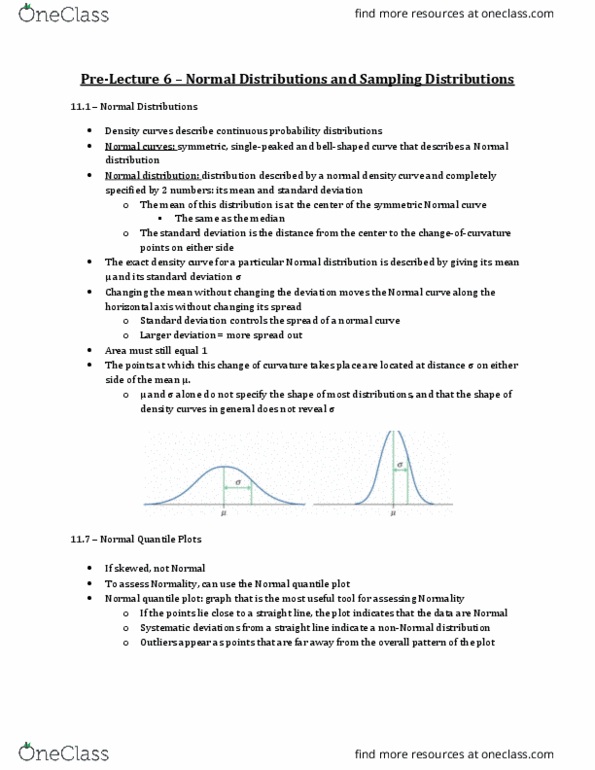
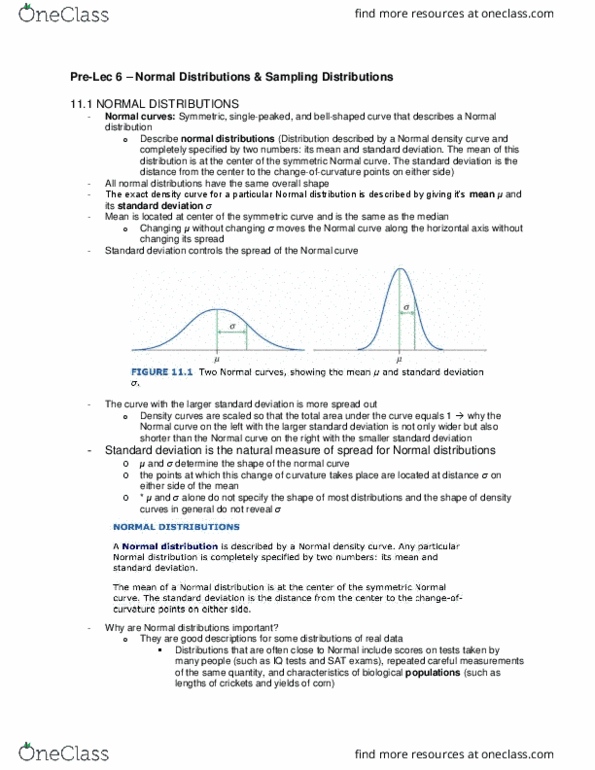
Normal distributions are symmetric, single peaked or bell shaped. All normal distributions have the same overall shape. Must describe a continuous random variable, not a discrete one. Mean is at the center of the curve and is the same as the median. Changing the mean without changing the standard deviation moves the curve along the horizontal axis without changing spread. Larger standard deviation has a more spread out curve. Area under all the curves equals 1 which represents the probability of the whole sample space. Standard deviation can be picked out on a normal curve at the point where there is a change in curvature steepness. Only distribution that the mean and standard deviation alone specify the shape (density curve) Good approximations of chance outcomes and usually represents real data. Histogram or dotplot can reveal non normal features of a distribution. Histogram or dotplot can reveal non normal features of a distribution (skew or outliers or clusters)