Biology 2244A/B Lecture Notes - Lecture 6: Statistical Inference, Categorical Variable, Normal Distribution

1 Jan 2017
School
Department
Course
Professor
Document Summary
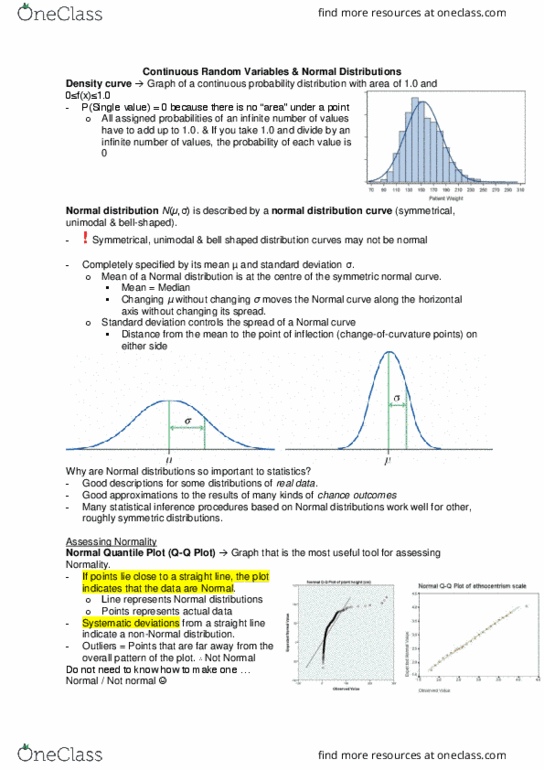
Pre-lecture 6 normal distributions and sampling distributions. Normal curves: symmetric, single-peaked and bell-shaped curve that describes a normal distribution. Normal distribution: distribution described by a normal density curve and completely specified by 2 numbers: its mean and standard deviation: the mean of this distribution is at the center of the symmetric normal curve. The same as the median: the standard deviation is the distance from the center to the change-of-curvature points on either side horizontal axis without changing its spread. The exact density curve for a particular normal distribution is described by giving its mean. Changing the mean without changing the deviation moves the normal curve along the: standard deviation controls the spread of a normal curve, larger deviation = more spread out. To assess normality, can use the normal quantile plot. Normal quantile plot: graph that is the most useful tool for assessing normality.