BUEC 232 Lecture 5: Lecture 5

25 Jan 2019
School
Department
Course
Professor
BUEC 232 verified notes
5/7View all
Document Summary
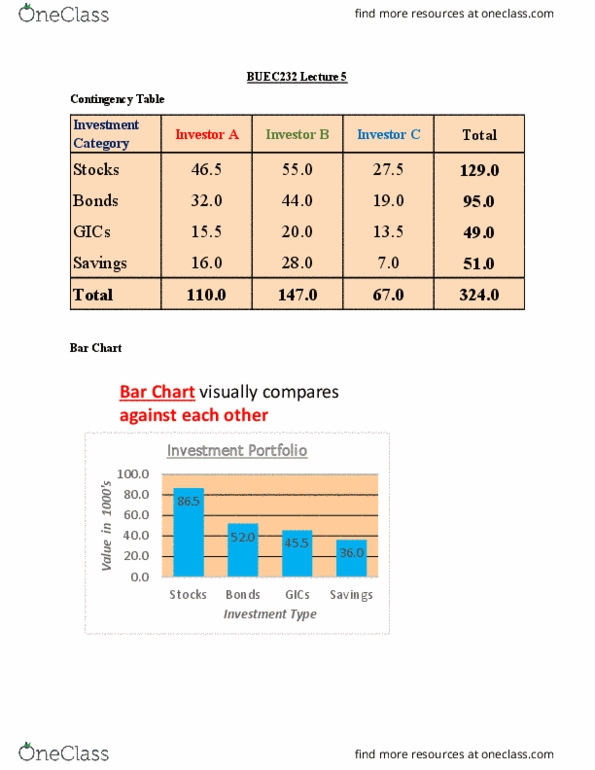
Note, pie chart % are typically rounded to the nearest % 0. 0 e v i t a u m u. 1 n i t n u o m. Expert fallacy: presenting a person as a trusted authority to be followed. E. g: commercials with doctors or other well groomed role models, charismatic and attractive politicians who appeal you to for your trust without giving more meaningful justification. Crowd psychology: presenting an audience or congregation of people who apparently share an opinion to give the illusion that it is the social norm. E. g: live audiences and laugh-tracks for tv shows and infomercials, cults that recruit by inviting targets to assemblies to hear their leaders speak, political rallies. A frequency distribution is a list or a table. It contains class groupings (ranges within which the data values fall: the corresponding frequencies with which data fall within each grouping or category, summarize numerical data, use frequency distribution to build visual representation for quick interpretation.