PSYC 204 Lecture Notes - Lecture 3: Quartile, Percentile, Bar Chart

Document Summary
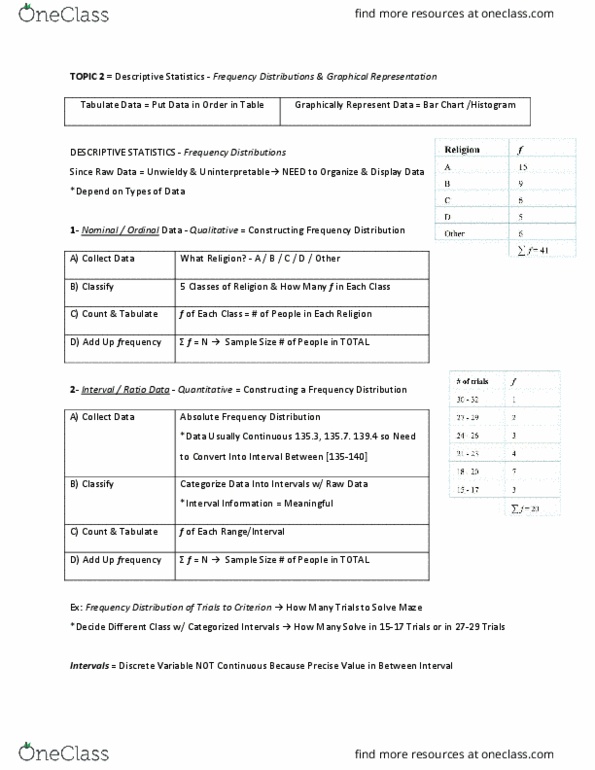
1- decide on number of classes: conventions = follow norm of. What is normally published in paper: round down = *round down. Ex: 110 observations = (cid:2778)(cid:2778)(cid:2777) = 10. 5 round to 10 classes. *convenient starting point = look at data & find minimum value in data. But usually use value lower than minimum number to include all ex: 3. 4 but use range of [3-5] *choose stopping point = maximum value in data class interval = maxi(cid:2923)u(cid:2923) mi(cid:2924)i(cid:2923)u(cid:2923) = (cid:2870)(cid:2870) (cid:2871) = 4. 7 round to class interval of 5 [width] Example - constructing a frequency distribution for the height of an statistic class: 1- decide on number of classes b) round down = = (cid:2778)(cid:2777)=11. 8 so round down to 11 classes (cid:2778)(cid:2778) (cid:1812)(cid:1801)(cid:1819)(cid:1819)(cid:1805)(cid:1819) = (cid:2873)(cid:2871)(cid:2778)(cid:2778) = 4. 8 5. Starting point = minimum value 145 - 0. 5 = 144. 5. Stop point = maximum value 197 + 0. 5 = 197. 5. *to prevent data falling in 2 categories = 144. 5-149. 49 / 149. 5-154. 49.