PSYC 204 Lecture Notes - Lecture 2: Bar Chart, Frequency (Statistics), Histogram


Document Summary
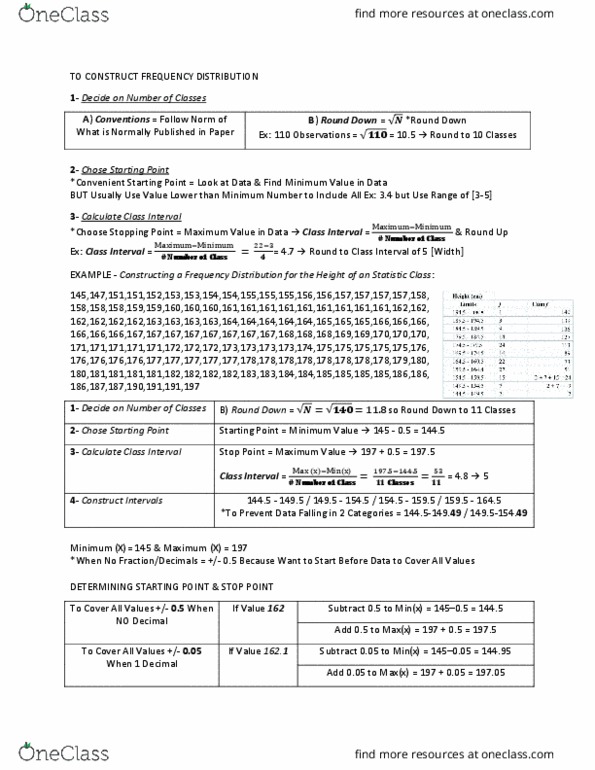
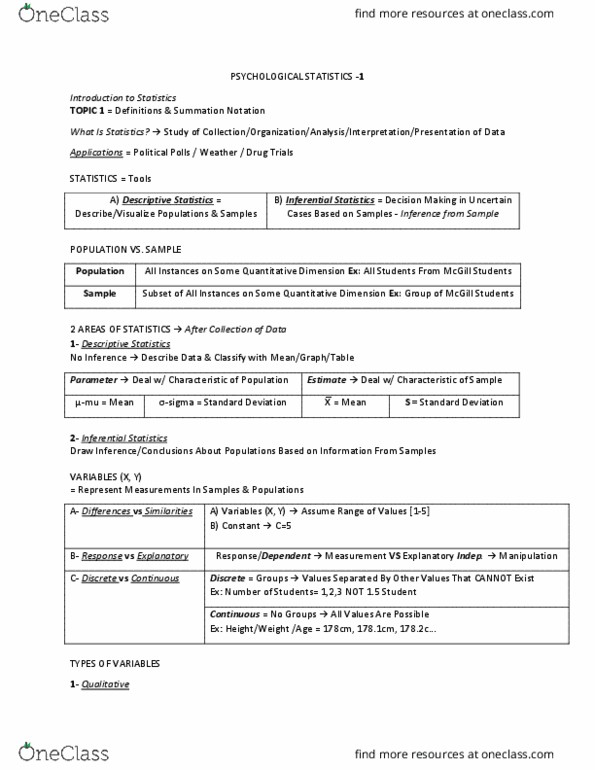
Topic 2 = descriptive statistics - frequency distributions & graphical representation. Tabulate data = put data in order in table. Since raw data = unwieldy & uninterpretable need to organize & display data. 1- nominal / ordinal data - qualitative = constructing frequency distribution: collect data. A / b / c / d / other: classify. 5 classes of religion & how many f in each class: count & tabulate f of each class = # of people in each religion, add up frequency. 2- interval / ratio data - quantitative = constructing a frequency distribution: collect data. 139. 4 so need to convert into interval between [135-140: classify. *interval information = meaningful: count & tabulate f of each range/interval, add up frequency. F = n sample size # of people in total. Ex: frequency distribution of trials to criterion how many trials to solve maze.