MATH 1060 Lecture Notes - Lecture 5: Box Plot

MATH 1060 verified notes
5/11View all
Document Summary
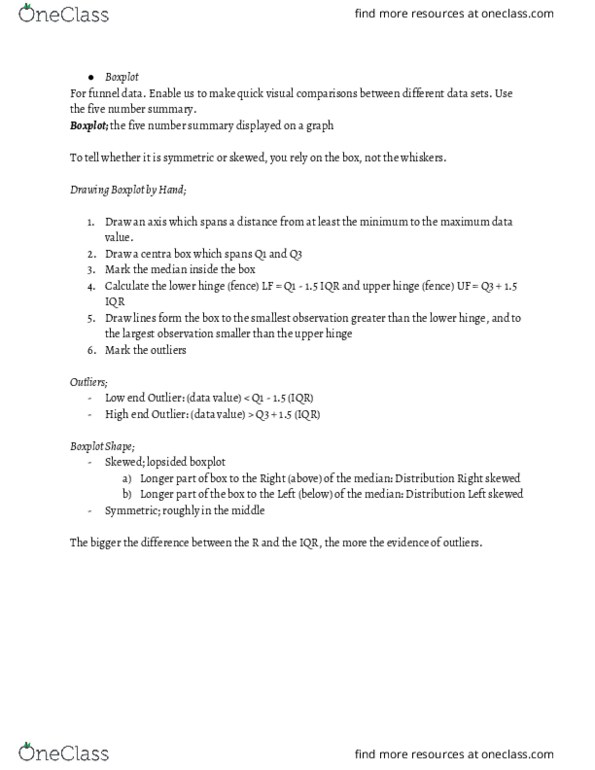
Enable us to make quick visual comparisons between different data sets. Boxplot; the five number summary displayed on a graph. To tell whether it is symmetric or skewed, you rely on the box, not the whiskers. Iqr: draw lines form the box to the smallest observation greater than the lower hinge, and to the largest observation smaller than the upper hinge, mark the outliers. Low end outlier: (data value) < q1 - 1. 5 (iqr) High end outlier: (data value) > q3 + 1. 5 (iqr) Skewed; lopsided boxplot: longer part of box to the right (above) of the median: distribution right skewed, longer part of the box to the left (below) of the median: distribution left skewed. The bigger the difference between the r and the iqr, the more the evidence of outliers. For smaller data sets, quicker to make and presents more detailed information. Useful to make a quick picture of a data set.