MATH 1060 Lecture 3: Choosing Measures of Variability/ Spread

MATH 1060 verified notes
3/11View all
Document Summary
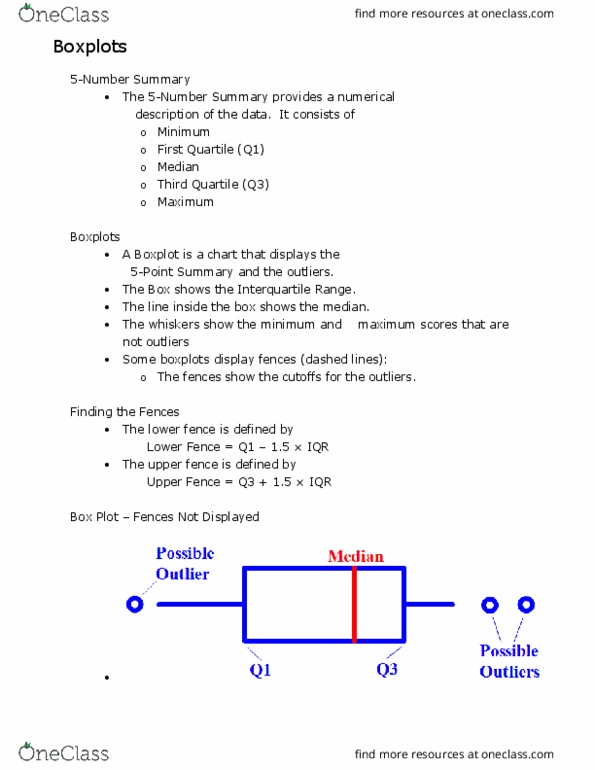
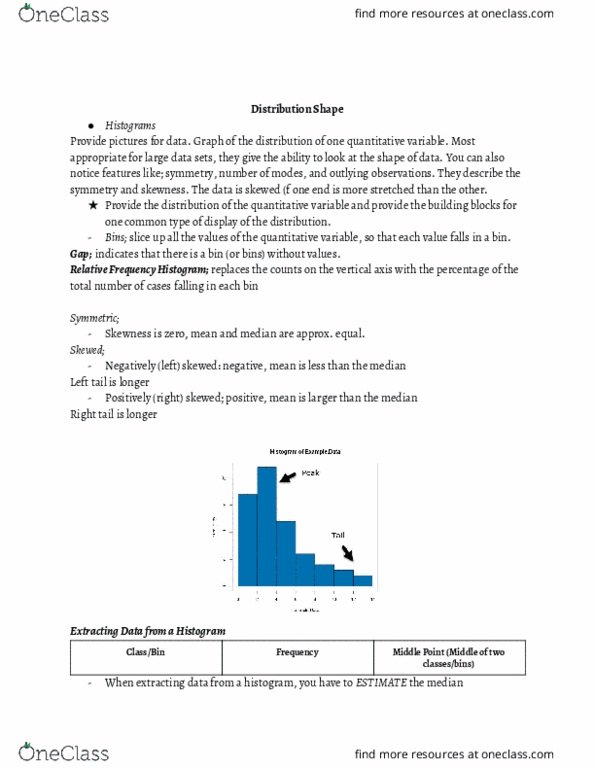
Because x and s are not resistant (they are sensitive to extreme observations), they can be misleading when the data are strongly skewed or have outliers. Because the two sides of skewed data have different spreads, no single number describes the spread well. The five-number summary is usually better than the x and s for describing a skewed data set with strong outliers. The smallest and largest observations tell us little about the distribution of the data as a whole. They give information about the tails of the distribution that is missing if we know only the median and the quartiles. To get a quick summary of both center and spread, combine all five numbers. The five number summary; reports the median, the quartiles, and extremes. An extremely high or extremely low data value, as compared to the rest of the data. Can make some descriptive statistics (like mean, standard deviation and range), very misleading.