PSYC 2001 Lecture Notes - Lecture 12: Central Tendency, Statistical Hypothesis Testing, Effect Size

12 Dec 2018
School
Department
Course
Professor
Document Summary
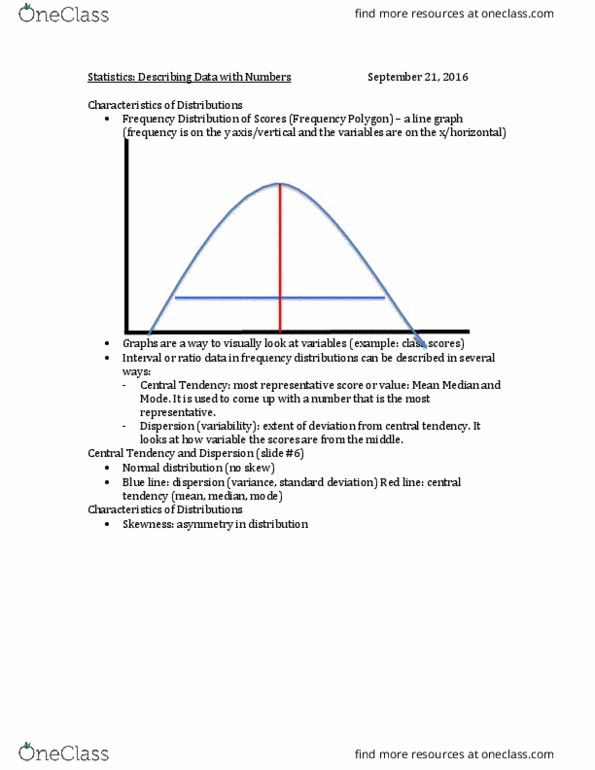
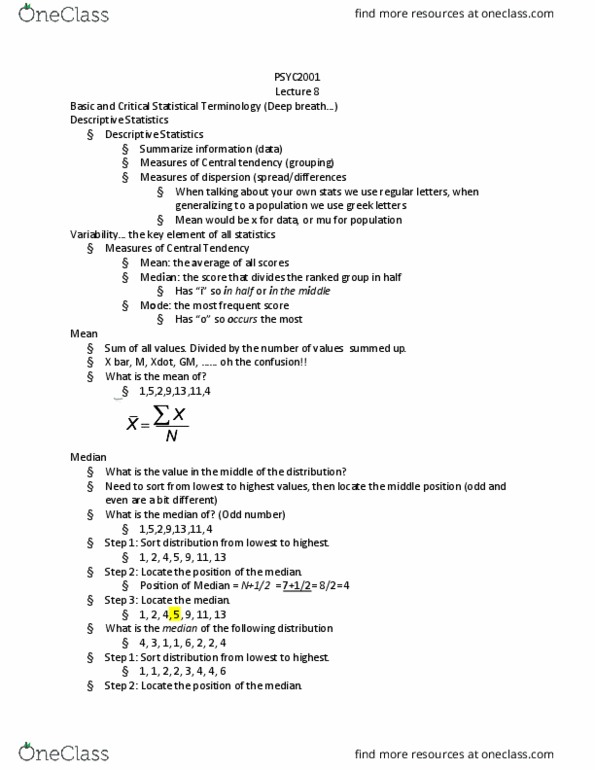
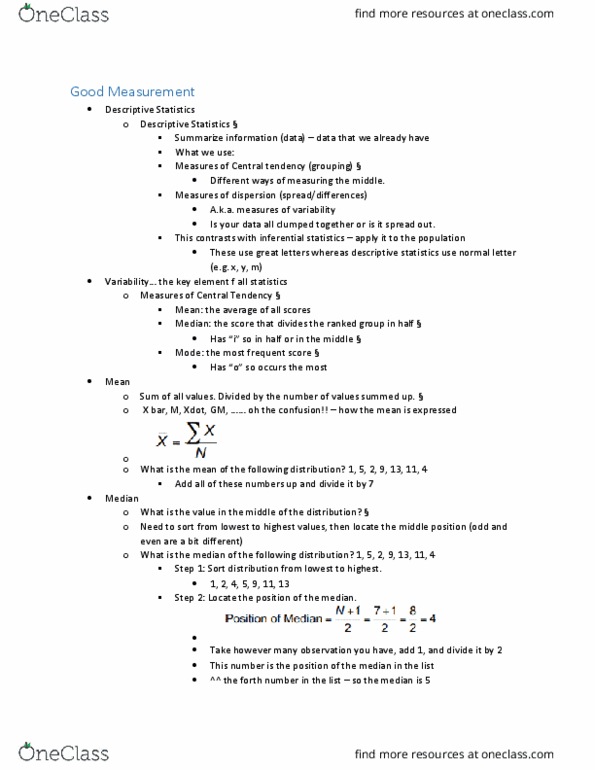
Errors still possible (type i & ii) Determine what test needs to be run. Compare statistic to critical value (found by looking up p-value in statistical tables) Interpretation what does it mean? (importance, effect size, impact in real world?) Median : the score that divides the ranked group in half. Sum of all values, divided by the number of values summed up. Need to sort from the lowest to highest values, then locate the middle position (odd and even are a bit different) Only looks at 2 pieces of data. Deviation = distance of each score from the mean. Sum the squared deviation and divide by the number summed gives us the average squared deviation. Variability: the key element of all statistical analyses. We can remove the squares unit by square-roofing both sides. All statistical tests (t-test, chi-squares, correlation, anova, etc. ) are explaining/examining the variability. We want variability research needs to be designed to have variability.