MATH 1P98 Lecture Notes - Lecture 5: Simple Random Sample, Quartile, Interquartile Range
MATH 1P98 verified notes
5/27View all
Document Summary
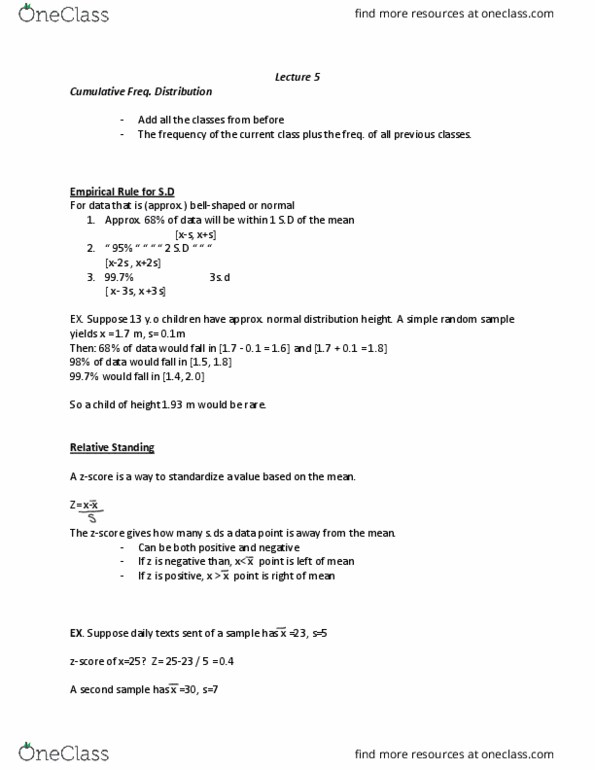
The frequency of the current class plus the freq. of all previous classes. For data that is (approx. ) bell-shaped or normal: approx. 68% of data will be within 1 s. d of the mean. Suppose 13 y. o children have approx. normal distribution height. A simple random sample yields x = 1. 7 m, s= 0. 1m. Then: 68% of data would fall in [1. 7 - 0. 1 = 1. 6] and [1. 7 + 0. 1 = 1. 8] 98% of data would fall in [1. 5, 1. 8] So a child of height 1. 93 m would be rare. A z-score is a way to standardize a value based on the mean. The z-score gives how many s. ds a data point is away from the mean. If z is negative than, x< x point is left of mean. If z is positive, x > x point is right of mean. Z= 28-30 / 7 = -0. 2857 standard deviations away.


