BUSS1020 Lecture Notes - Lecture 13: Quadratic Function, Total Variation, Analysis Of Variance

13 Sep 2018
School
Department
Course
Professor
Document Summary
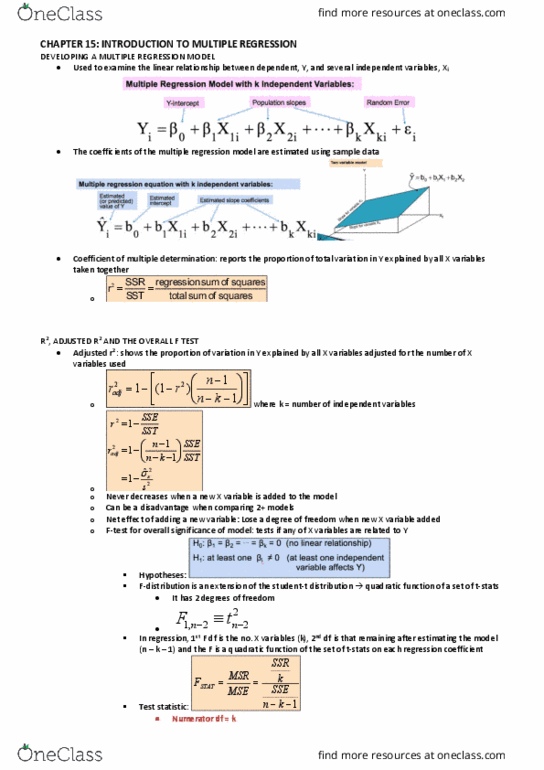
Goal: examine the linear relationship between dependant variable y and 2 or more independent variables (xi) k independent variables: Coefficient of multiple determination (r2): reports the proportion of total variation in y explained by all x variables taken together. Good measure of how well the regression model is able to predict the dependant variable still the same equation as before. Interpretation- e. g. 52. 1% of variation in sales in explained by the variation in price and advertising. Accounts for the extra variables (diff between r2 and adjusted r2) In general, r2 will always increase if more independent variables are added (never decreases when adding) can be disadvantage when comparing 2+ models. It shows the proportion of y explained by all x variables adjusted for the number of x variables used: (cid:3038) (cid:2869) is the ratio between df(cid:495)s and is the correction factor. ^ (cid:2869: as we increase k correction factor paralyses the r squared because denominator increases.