BUSS1020 Lecture Notes - Lecture 11: Homoscedasticity, Checkbox, Interval Estimation

13 Sep 2018
School
Department
Course
Professor
Document Summary
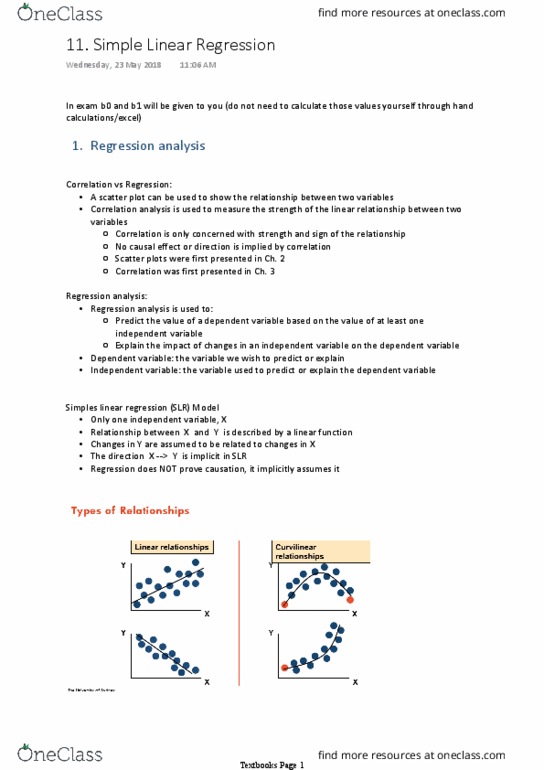
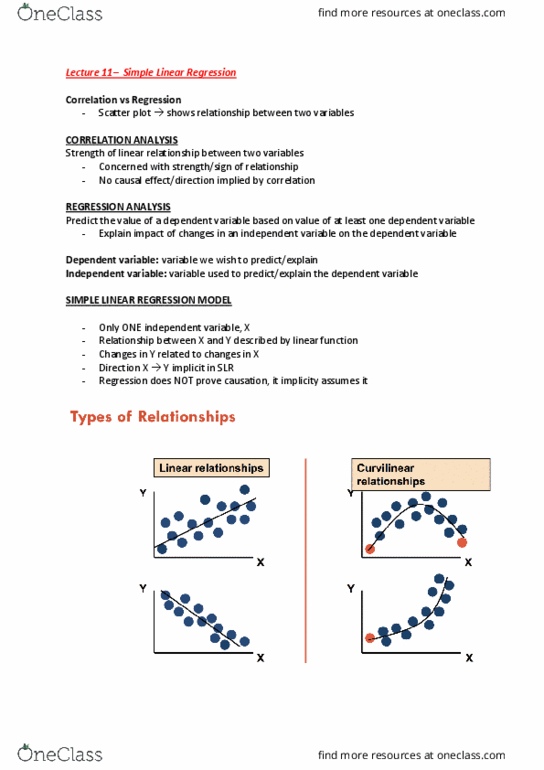
Scatter plot shows relationships between 2 variables. Correlation analysis used to: measure strength of linear relationship between 2 variables, only concerned with strength+ sign of relationship, no causal effect/direction implied. Regression analysis used to: predict value of a dependant variable based on at least 1 independent variable, explain the impact of changes in an independent variable on the dependant var. Note: regression does not prove causation- it implicitly assumes it. Simple linear regression equation (prediction line): provides an estimate of the population regression line. Note: since =(cid:1851) (cid:1851) you are just minimising the squared distance between the line and the point. The process by which a regression model is developed is based on calculus techniques (cid:523)don(cid:495)t need to know(cid:524) producing a minimum sum of squared values: And hence b1 is calculated by (cid:3299)(cid:3300)(cid:3299)(cid:3299): given (cid:1851) =(cid:2868)+(cid:2869)(cid:1850): When using a regression model for predictions, only predict within the relevant. Total variation made up of 2 parts: