BUSS1020 Lecture Notes - Lecture 1: Accounting, Pivot Table, Business Analytics

13 Sep 2018
School
Department
Course
Professor
Document Summary
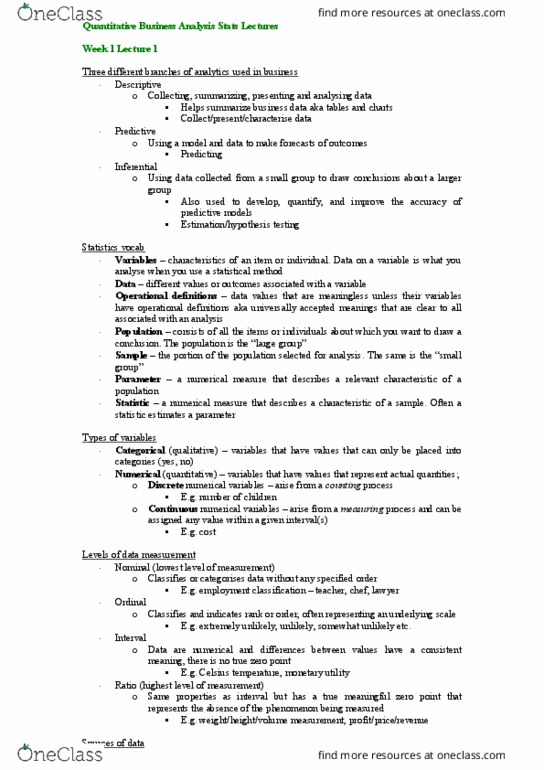
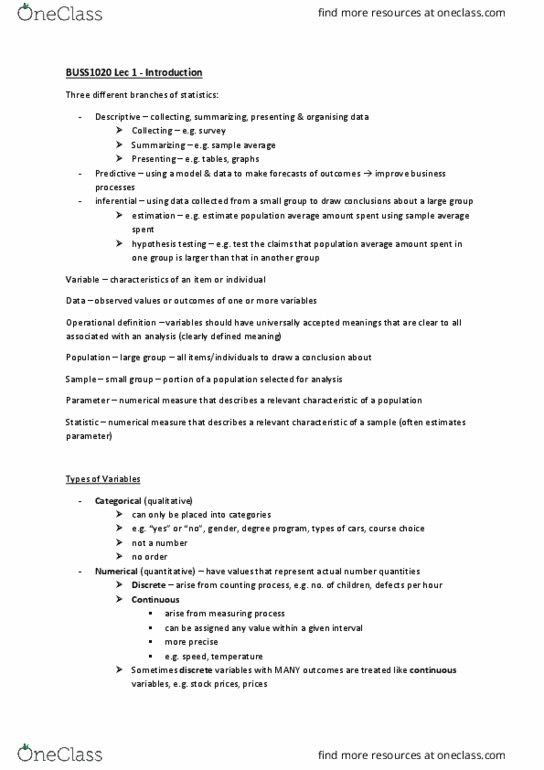
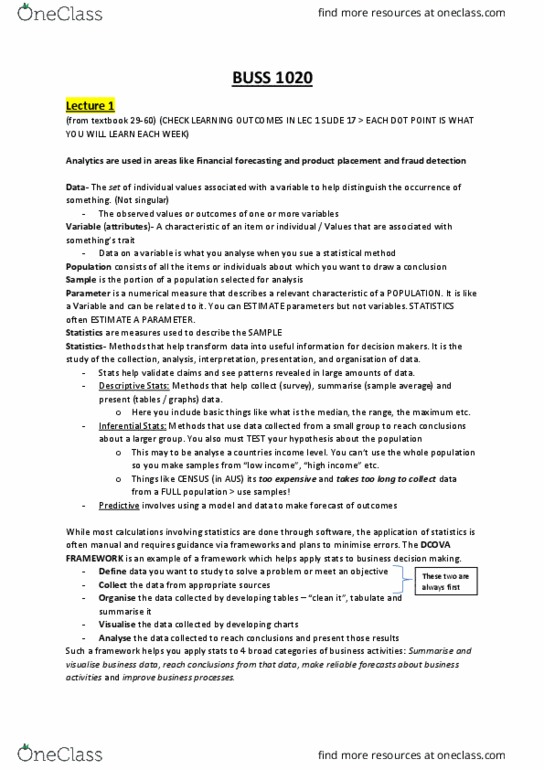
Make better sense of the world- create credibility. Descriptive: collecting (survey) presenting (tables) characterising (mean, median etc. ) data in engaging way; data visualisation, used to create charts/tables. Predictive: using a model and data to make forecasts of outcomes based on customer attributes. Inferential: using data collected from small group to draw conclusions about larger; time consuming to assess entire pop. Areas analytics most often used; financial forecasting, fraud detection etc. Data on a variable is analysed for stats. Data: different values/outcomes associated with a variable. Operational definitions: universally accepted meanings for data variables. Sample: portion of the pop selected for analysis (subset) Parameter: numerical measure describing relevant characteristic of pop (e. g. mean, median- uses greek letters) Statistic: numerical measure describing characteristic of sample (used to estimate parameter)- uses roman letters. Categorical (qualitative) variables have values only placed into categories: e. g. yes/no, colours.