BUSS1020 Lecture Notes - Lecture 1: Sampling Frame, Product Placement, Business Analytics

27 Jul 2018
School
Department
Course
Professor

BUSS 1020
Lecture 1
(from textbook 29-60) (CHECK LEARNING OUTCOMES IN LEC 1 SLIDE 17 > EACH DOT POINT IS WHAT
YOU WILL LEARN EACH WEEK)
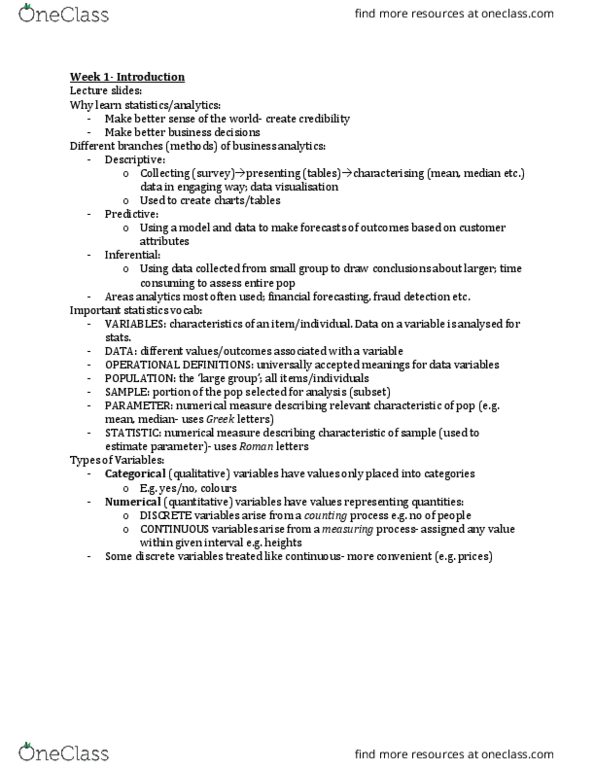
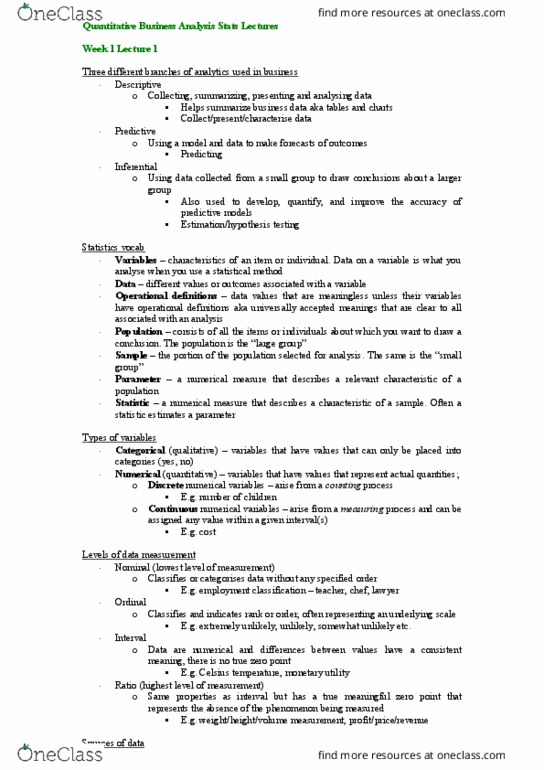
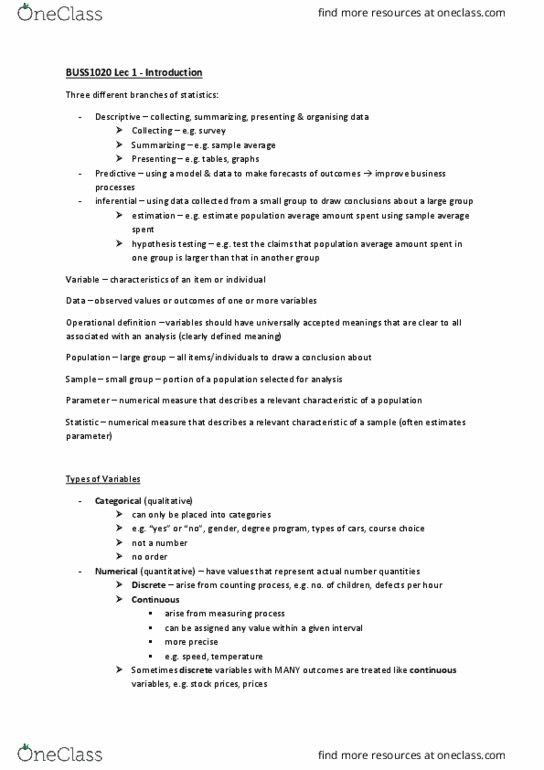
Analytics are used in areas like Financial forecasting and product placement and fraud detection
Data- The set of individual values associated with a variable to help distinguish the occurrence of
something. (Not singular)
- The observed values or outcomes of one or more variables
Variable (attributes)- A characteristic of an item or individual / Values that are associated with
something’s trait
- Data on a variable is what you analyse when you sue a statistical method
Population consists of all the items or individuals about which you want to draw a conclusion
Sample is the portion of a population selected for analysis
Parameter is a numerical measure that describes a relevant characteristic of a POPULATION. It is like
a Variable and can be related to it. You can ESTIMATE parameters but not variables. STATISTICS
often ESTIMATE A PARAMETER.
Statistics are measures used to describe the SAMPLE
Statistics- Methods that help transform data into useful information for decision makers. It is the
study of the collection, analysis, interpretation, presentation, and organisation of data.
- Stats help validate claims and see patterns revealed in large amounts of data.
- Descriptive Stats: Methods that help collect (survey), summarise (sample average) and
present (tables / graphs) data.
o Here you include basic things like what is the median, the range, the maximum etc.
- Inferential Stats: Methods that use data collected from a small group to reach conclusions
about a larger group. You also must TEST your hypothesis about the population
o This may to be analyse a countries income level. You can’t use the whole population
so you make samples from “low income”, “high income” etc.
o Things like CENSUS (in AUS) its too expensive and takes too long to collect data
from a FULL population > use samples!
- Predictive involves using a model and data to make forecast of outcomes
While most calculations involving statistics are done through software, the application of statistics is
often manual and requires guidance via frameworks and plans to minimise errors. The DCOVA
FRAMEWORK is an example of a framework which helps apply stats to business decision making.
- Define data you want to study to solve a problem or meet an objective
- Collect the data from appropriate sources
- Organise the data collected by developing tables – “clean it”, tabulate and
summarise it
- Visualise the data collected by developing charts
- Analyse the data collected to reach conclusions and present those results
Such a framework helps you apply stats to 4 broad categories of business activities: Summarise and
visualise business data, reach conclusions from that data, make reliable forecasts about business
activities and improve business processes.
These two are
always first
Document Summary
Lecture 1 (from textbook 29-60) (check learning outcomes in lec 1 slide 17 > each dot point is what. Analytics are used in areas like financial forecasting and product placement and fraud detection. Data- the set of individual values associated with a variable to help distinguish the occurrence of something. (not singular) The observed values or outcomes of one or more variables. Variable (attributes)- a characteristic of an item or individual / values that are associated with so(cid:373)ethi(cid:374)g(cid:859)s t(cid:396)ait. Data on a variable is what you analyse when you sue a statistical method. Population consists of all the items or individuals about which you want to draw a conclusion. Sample is the portion of a population selected for analysis. Parameter is a numerical measure that describes a relevant characteristic of a population. It is like a variable and can be related to it. Statistics are measures used to describe the sample.