BUSS1020 Lecture Notes - Lecture 3: Box Plot, Covariance, Interquartile Range

22 Aug 2018
School
Department
Course
Professor
Document Summary
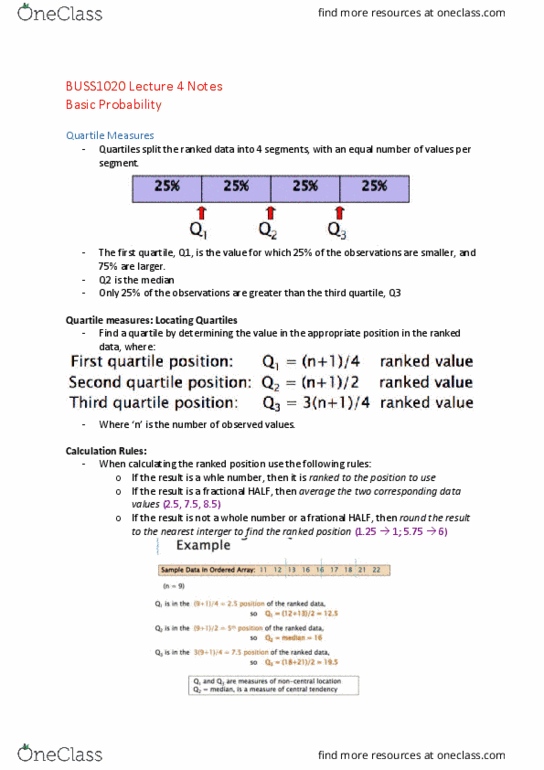
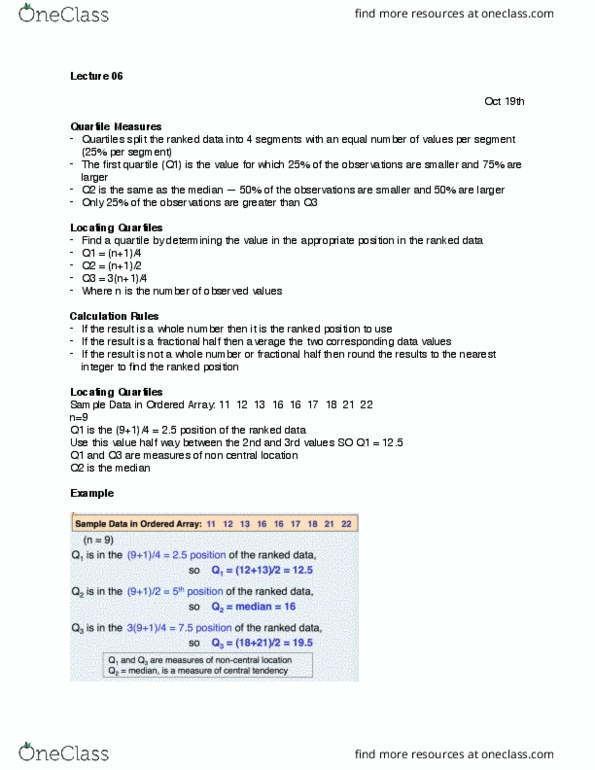
Quartiles spilt ranked data into 4 segments with an equal no. of values per segment. 1st quartile (q1) 25% of observations are smaller & 75% are larger. 2nd quartile same as median 50% of observations are smaller & 50% are larger. 3rd quartile 25% of observations are larger & 75% are smaller. Determine the location index (position of ranked data) of the quartile. Whole no exact no. on the ordered array rank position. Fractional half (e. g. 2. 5) average 2 corresponding data values (same as median) Always sample size plus 1 (n+1 / 4) find the rank use the data to find quartile (not rank!!) For q3, 3(n+1)/4 to find position of ranked data average of the 2 data values. Q3 q1 , excluding top & end 25% of the data measures the spread in the middle 50% of the data. Measure of variability not influenced by outliers / extreme values. Middle class incomers iqr is a good measure.