QMS 102 Lecture Notes - Lecture 6: Interquartile Range, Quartile, Box Plot

10 Apr 2017
School
Department
Course
Professor
Document Summary
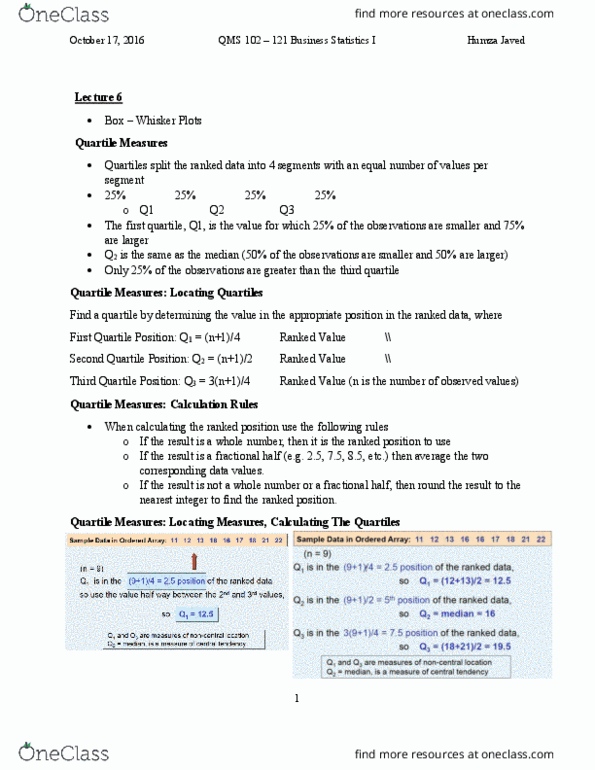
Quartiles split the ranked data into 4 segments with an equal number of values per segment (25% per segment) The rst quartile (q1) is the value for which 25% of the observations are smaller and 75% are larger. Q2 is the same as the median 50% of the observations are smaller and 50% are larger. Only 25% of the observations are greater than q3. Find a quartile by determining the value in the appropriate position in the ranked data. Where n is the number of observed values. If the result is a whole number then it is the ranked position to use. If the result is a fractional half then average the two corresponding data values. If the result is not a whole number or fractional half then round the results to the nearest integer to nd the ranked position. Sample data in ordered array: 11 12 13 16 16 17 18 21 22 n=9.