PS295 Chapter Notes - Chapter 7: Scatter Plot, Statistical Significance


CHAPTER 7: THE RELATIONSHIP BETWEEN TWO OR MORE VARIABLES
-we determine whether one variable is related to another by seeing whether scores on the two
variables covary (whether they vary/change together)
-correlational research is used to describe the relationship between 2 or more vvariables
Correlational coefficients
-index of the direction and magnitude of the relationship between 2 variables
-numerical value of a correlation coefficient always ranges from -1.00 to +1.00
-statistic that indicates degree to which two variables are related to one another in a linear fashion
-positive correlation: direct positive relationship (increase or decrease together)
-negative correlation: inverse, negative relationship (as one increases, the other decreases)
-does not tell us about curvilinear relationshops
Pearson correlation coefficient (r):
-most commonly used measure of correlation
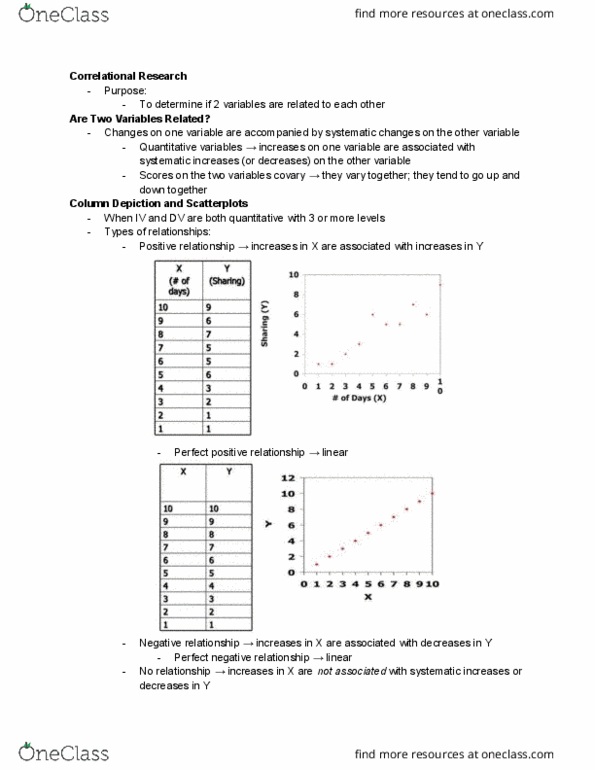
Scatter plot:
-when scores for an entire sample are plotted
-researchers regularly examine scatter plots of their data to be sure variables are not curvilinearly
related
The Coefficient of Determination: