PS295 Lecture Notes - Lecture 9: Coefficient Of Determination, Partial Correlation


Correlational Research
-assesses the relationship between two or more variables
-avoid causal language
-conducted to examine the degree to which two or more variables covary
-a correlation coefficient is a statistic that indicates the degree to which variables covary
Pearson correlation coefficient (r)
-most common correlation coefficient
-assesses the linear relationship between 2 variables (ex x and y)
-variables must be measured on an interval or ratio scale
-r ranges between +1.00 and –1.00
Interpretation of correlation coefficient is based on two characteristics:
1) direction:
-determined by sign in front of the r value (+ or -)
-positive: as scores of 1 increase, scores of the other increase/as one decreases the other decreases
-negative: as scores of one increase, the other decreases
2) magnitude:
-determined by numerical value r (close to 1 is stronger)
-+1.00 and -1.00 is a perfect linear correlation
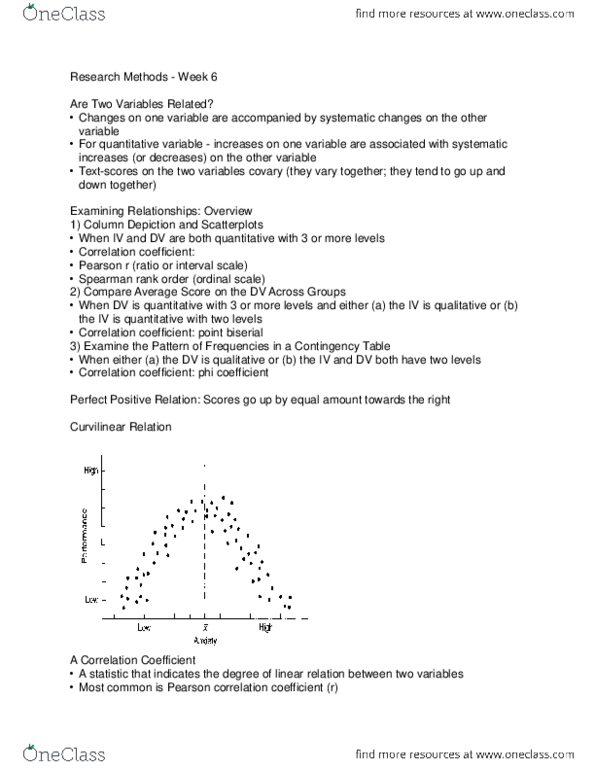
-a value of 0 = no linear correlation
Coefficient of determination (r²):
Document Summary
Assesses the relationship between two or more variables. Conducted to examine the degree to which two or more variables covary. A correlation coefficient is a statistic that indicates the degree to which variables covary. Assesses the linear relationship between 2 variables (ex x and y) Variables must be measured on an interval or ratio scale. Interpretation of correlation coefficient is based on two characteristics: direction: Determined by sign in front of the r value (+ or -) Positive: as scores of 1 increase, scores of the other increase/as one decreases the other decreases. Negative: as scores of one increase, the other decreases: magnitude: Determined by numerical value r (close to 1 is stronger) +1. 00 and -1. 00 is a perfect linear correlation. A value of 0 = no linear correlation. The squared correlation coefficient is called the coefficient of determination. Tells ur something about the shared variance between 2 variables.