BIO361H5 Chapter Notes - Chapter 6: Hypergeometric Distribution, Null Hypothesis, Categorical Variable

Document Summary
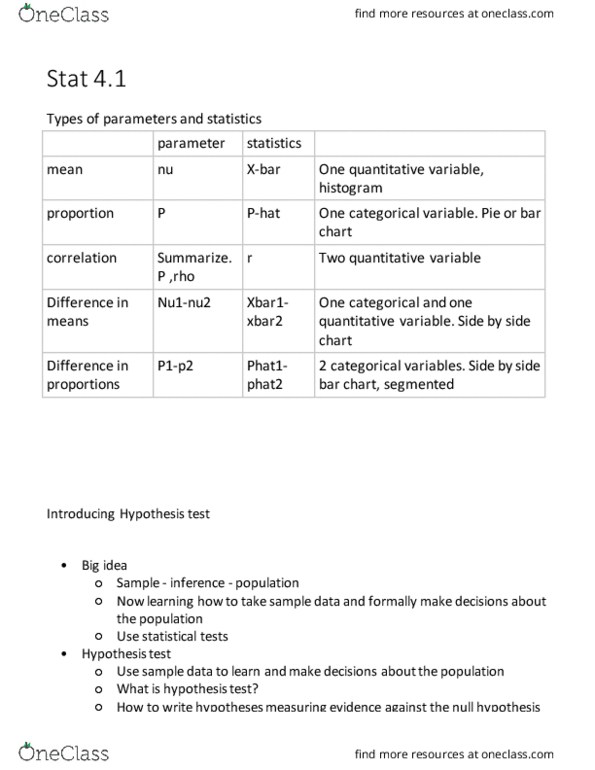
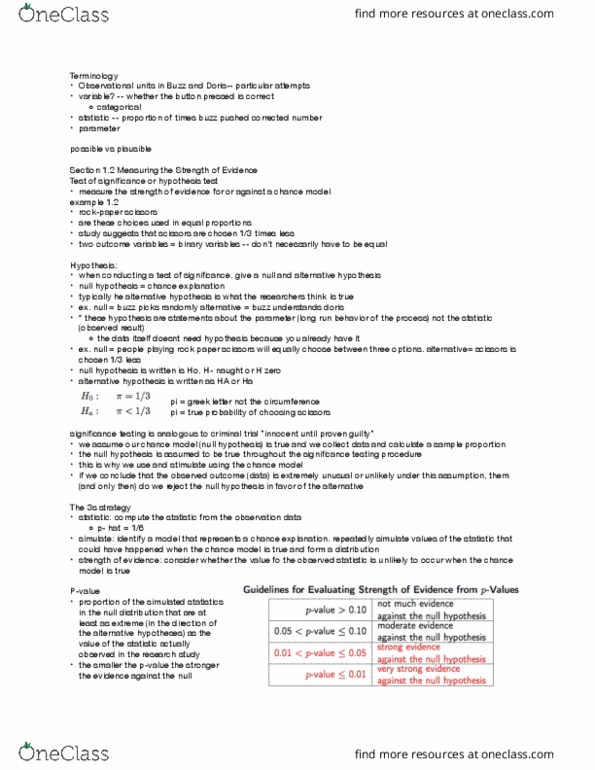
W/ categorical variables we focus on the proportion (or %) of responses that fall into each category. Can compare variables in contingency tables, bar graphs, segmented (stacked bar graph) General null hypothesis: true proportion of two groups are the same: note: the null hypothesis for a simulation using categorical data according to richter was that observed and simulated counts are the same. P-value was estimated by simulating taking samples many times under the assumption that 1) variables are independent (same proportions) and 2) that the counts from data set were observed (that row and column totals are fixed) Since we observed 17 cells that were both concave and malignant in the sample, we will simulate the likelihood of finding. 17 or more (concave + malignant) cells (ex. of a permutation test) Results of computer simulation: write malignant on 24 cards and benign on 13 cards (total. Fischer"s exact test uses the hypergeometric distribution to calculate exact probabilities (p-values)