ACCT-3001EL Chapter 3: CVP Analysis

Get access


Related Documents
Related Questions
1) All of the following are examples of product costs except:
depreciation on the company's administrative offices.
salary of the plant manager.
insurance on the factory equipment.
rental costs of the factory facility.
2) Period costs:
are treated as expenses in the period they are incurred
are directly traceable to products
include direct labor
are also referred to as manufacturing overhead costs
.
3) Axle and Wheel Manufacturing currently produces 1,000 axles per month. The following per unit data apply for sales to regular customers:
Direct materials $30
Direct manufacturing labor 5
Variable manufacturing overhead 10
Fixed manufacturing overhead 40
Total manufacturing costs $85
The plant has capacity for 2,000 axles and is considering expanding production to 1,500 axles. What is the total cost of producing 1,500 axles?
a. $85,000
b. $170,000
c. $107,500
d. $102,500
4) In the preparation of the schedule of Cost of Goods Manufactured, the accountant incorrectly included as part of manufacturing overhead the rental expense on the firm's retail facilities. This inclusion would:
overstate period expenses on the income statement.
overstate the cost of goods sold on the income statement.
understate the cost of goods manufactured.
have no effect on the cost of goods manufactured.
5) In CVP analysis, focusing on target net income rather than operating income:
a. will increase the breakeven point
b. will decrease the breakeven point
c. will not change the breakeven point
d. does not allow calculation of breakeven point
6) A variable cost is constant if expressed on a per unit basis but the total dollar amount changes as the number of units increases or decreases.
a. True
b. False
7) As activity increases within the relevant range, fixed costs remain constant on a per unit basis.
a. True
b. False
8) Which of the following statements is correct with regard to a CVP graph?
A CVP graph shows the maximum possible profit.
A CVP graph shows the break-even point as the intersection of the total sales revenue line and the total expense line.
A CVP graph assumes that total expense varies in direct proportion to unit sales.
A CVP graph shows the operating leverage as the gap between total sales revenue and total expense at the actual level of sales.
9) How would the following costs be classified (product or period) under variable costing at a retail clothing store?
| Cost of purchasing clothing | Sales commissions | |
| a. | Product | Product |
| b. | Product | Period |
| c. | Period | Product |
| d. | Period | Period |
10) The principal difference between variable costing and absorption costing centers on:
whether variable manufacturing costs should be included as product costs.
whether fixed manufacturing costs should be included as product costs.
whether fixed manufacturing costs and fixed selling and administrative costs should be included as product costs.
none of these.
11) Joe has a hot dog cart that he parks on the NY sidewalk and sells hotdogs during the day. The variable cost of a hot dog is $.90. The selling price of the hot dog is $2.00. The fixed cost is $3,000 per month which covers the loan for the cart and the salary Joe needs to make to live. How many hotdogs must Joe sell in one month in order to break even?
3,300 hot dogs
3,000 hot dogs
2,727.27 hot dogs
2,728 hot dogs
12) Shun Corporation manufactures and sells a hand held calculator. The following information relates to Shun's operations for last year:
| Unit product cost under variable costing.......................... | $5.20 per unit | |
| Fixed manufacturing overhead cost for the year.............. | $260,000 | |
| Fixed selling and administrative cost for the year............ | $180,000 | |
| Units (calculators) produced and sold.............................. | 400,000 |
What is Shun's unit product cost under absorption costing for last year?
$4.10
$4.55
$5.85
$6.30.
Use the following information to answer questions 13 to 15:
Barnett Company uses the weighted-average method in its process costing system. The company adds materials at the beginning of the process in Department M. Conversion costs were 75% complete with respect to the 4,000 units in work in process at May 1 and 50% complete with respect to the 6,000 units in work in process at May 31. During May, 14,000 units were started, 12,000 units were completed and transferred to the next department.
13) Calculate the number of equivalent units for materials.
10,000 units
12,000 units
14,000 units
15,000 units
18,000 units
14) Calculate the number of equivalent units for conversion?
10,000 units
12,000 units
14,000 units
15,000 units
18,000 units
15) An analysis of the costs relating to work in process at May 1 and to production activity for May follows:
| Materials | Conversion | ||
| Work in process 5/1....................... | $13,800 | $3,740 | |
| Costs added during May................ | $42,000 | $26,260 |
The total cost per equivalent unit for May was:
$5.02
$5.10
$5.12
$5.25

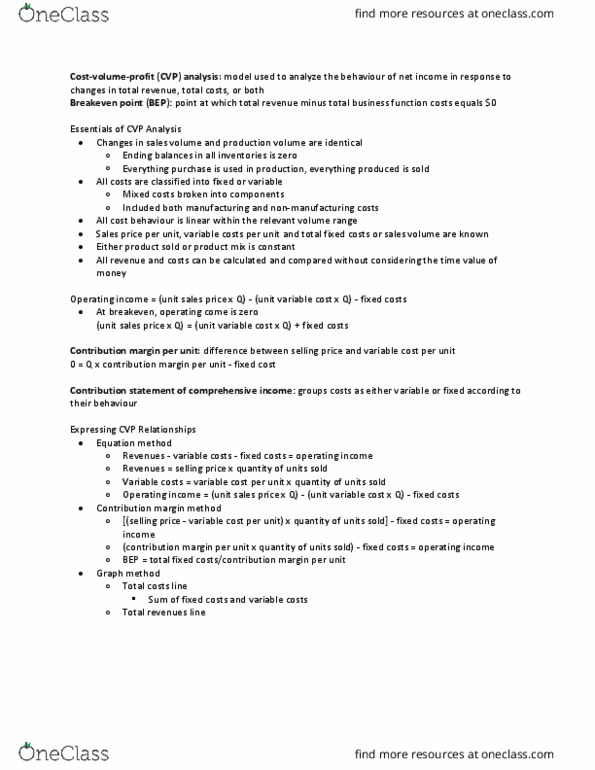
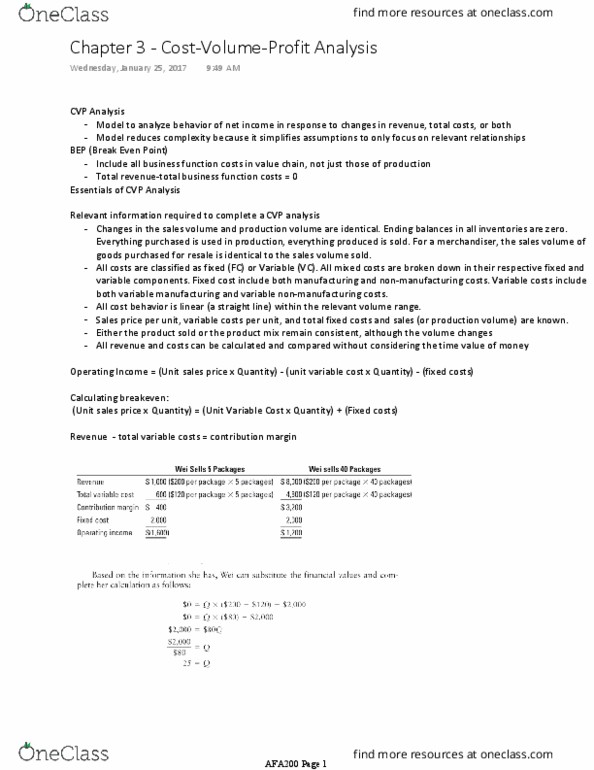
Overview: Classifying a companyâs costs allows for an in-depthanalysis of the impact that changes in output have on revenues,costs, and net income or net loss. A cost-volume-profit (CVP)analysis will be completed in order to determine the breakevenpoint. Relevant costs will be used to prepare a flexible budget.Additionally, an appropriate costing system should be selected andthe choice should be substantiated with reasonable rationale.Finally, a memo should be prepared for management that summarizesthe results of the quantitative analysis and makes recommendationsfor an optimal costing system to be ethically used by key decisionmakers. For Milestone One, you will use the MDE ManufacturingBudget (Table I) to analyze costs, contribution margin, andbreakeven point for the bird feeder division of the company. In Tab1 of your Student Workbook, classify costs as either product orperiod costs. Briefly explain the difference between the types ofcosts. Then, analyze the actual costs and, using Tab 2 of yourStudent Workbook, complete a cost-volume-profit analysis todetermine how many bird feeders must be sold at the current costand sales price level to earn a 10% profit and how much the salesprice would have to increase to earn a 10% profit at the same costand sales volume level. Submit the Student Workbook with Tabs 1 and2 completed with your cost calculations and a 1â2 page Worddocument that explains the implications of your findings andaddresses all of the critical elements in Section I.
I. Salesand Manufacturing Expenses: Budget and Actual (2014)
You will use this table to complete Milestones One and Two.
Budget ($) | Actual ($) | |
Sales | 1,050,000 | 991,700 |
Expenses | ||
Materials â Cedar | 225,000 | 248,160 |
Materials â Plastic | 37,500 | 37,741 |
Factory Worker Labor | 300,000 | 332,760 |
Materials â Indirect | 3,000 | 2,585 |
Factory Depreciation | 78,000 | 78,000 |
Factory Utilities | 12,000 | 12,000 |
Factory Maintenance and Repairs | 5,000 | 4,500 |
Shipping ($2.25/each) | 112,500 | 105,750 |
Sales Commissions ($2.00/unitsold) | 100,000 | 94,000 |
Office Rent | 12,000 | 12,000 |
Advertising | 20,000 | 20,000 |
Liability insurance | 5,000 | 5,000 |
Office Depreciation | 1,000 | 1,000 |
Office Salaries | 48,000 | 48,000 |
Total Expenses | 959,000 | 1,001,496 |
II. Contribution Margin: Static Budget and Actual Results (2014)
You will use this table to complete Milestone Two.
Actual Results | Static Budget Amount | |
Units Sold | 47,000 | 50,000 |
Revenues ($) | 991,700 | 1,050,000 |
Manufacturing Costs ($) | ||
Variable | 621,246 | 565,500 |
Fixed | 94,500 | 95,000 |
Gross Margin | 275,954 | 389,500 |
| Milestone One,Part I | ||
| Product Costs | ||
| Period Costs | ||
| Totals | Totals | ||||||||||
| Budget | Actual | ||||||||||
| Sales Price per Unit | |||||||||||
| Variable Costs | |||||||||||
| Materials - Cedar | |||||||||||
| Materials - Plastic | |||||||||||
| Factory Worker Labor | |||||||||||
| Materials - Indirect | |||||||||||
| Shipping ($2.25/ea) | |||||||||||
| Sales Commissions ($2/unit sold) | |||||||||||
| Variable Cost per Unit | |||||||||||
| Contribution Margin | |||||||||||
| Fixed Costs | |||||||||||
| Factory Depreciation | |||||||||||
| Factory Utilities | |||||||||||
| Factory Maintenance and Repairs | |||||||||||
| Office Rent | |||||||||||
| Advertising | |||||||||||
| Liability Insurance | |||||||||||
| Office Depreciation | |||||||||||
| Office Salaries | |||||||||||
| Total Fixed Costs | |||||||||||
| Using Budgeted Amounts | |||||||||||
| Breakeven Point - | Breakeven Point - | ||||||||||
| Using Actual Amounts | Units at Current Sales Price | ||||||||||
| + 10,000 profit | |||||||||||
| Using actual amounts | New Contribution Margin | ||||||||||
| + 10,000 profit | Current Variable Costs | ||||||||||
| New Sales Price | |||||||||||

Integrative Exercise
Cost Behavior and Cost-Volume-Profit Analysis for Many GlacierHotel
Using the High-Low Method to Estimate Variable and FixedCosts
Located on Swiftcurrent Lake in Glacier National Park, ManyGlacier Hotel was built in 1915 by the Great Northern Railway. Inan effort to supplement its lodging revenue, the hotel decided in20X1 to begin manufacturing and selling small wooden canoesdecorated with symbols hand painted by Native Americans living nearthe park. Due to the great success of the canoes, the hotel beganmanufacturing and selling paddles as well in 20X3. Many hotelguests purchase a canoe and paddles for use in self-guided tours ofSwiftcurrent Lake. Because production of the two products began indifferent years, the canoes and paddles are produced in separateproduction facilities and employ different laborers. Each canoesells for $500, and each paddle sells for $50. A 20X3 firedestroyed the hotelâs accounting records. However, a new system putinto place before the 20X4 season provides the following aggregateddata for the hotelâs canoe and paddle manufacturing and marketingactivities:
| Manufacturing Data: | ||||||||||||||
| Year | Number of Canoes Manufactured | Total Canoe Manufacturing Costs | Year | Number of Paddles Manufactured | Total Paddle Manufacturing Costs | |||||||||
| 20X9 | 250 | $103,000 | 20X9 | 900 | $38,500 | |||||||||
| 20X8 | 275 | 128,000 | 20X8 | 1,200 | 49,000 | |||||||||
| 20X7 | 240 | 108,000 | 20X7 | 1,000 | 44,000 | |||||||||
| 20X6 | 310 | 114,000 | 20X6 | 1,100 | 45,500 | |||||||||
| 20X5 | 350 | 141,500 | 20X5 | 1,400 | 52,000 | |||||||||
| 20X4 | 400 | 140,000 | 20X4 | 1,700 | 66,500 | |||||||||
| Marketing Data: | ||||||||||||||
| Year | Number of Canoes Sold | Total Canoe Marketing Costs | Year | Number of Paddles Sold | Total Paddle Marketing Costs | |||||||||
| 20X9 | 250 | $45,000 | 20X9 | 900 | $7,500 | |||||||||
| 20X8 | 275 | 43,000 | 20X8 | 1,200 | 9,000 | |||||||||
| 20X7 | 240 | 44,000 | 20X7 | 1,000 | 8,000 | |||||||||
| 20X6 | 310 | 51,000 | 20X6 | 1,100 | 8,500 | |||||||||
| 20X5 | 350 | 62,000 | 20X5 | 1,400 | 10,000 | |||||||||
| 20X4 | 400 | 60,000 | 20X4 | 1,700 | 11,500 | |||||||||
Required:
1. High-Low Cost Estimation Method
a. Use the high-low method to estimate the per-unit variablecosts and total fixed costs for the canoe productline.
| Variable cost per unit | $ |
| Total fixed cost | $ |
b. Use the high-low method to estimate the per-unit variablecosts and total fixed costs for the paddle productline.
| Variable cost per unit | $ |
| Total fixed cost | $ |
2. Cost-Volume-Profit Analysis, Single-ProductSetting
Use CVP analysis to calculate the break-even point in units for
a. The canoe product line only (i.e.,single-product setting)
| BE units | canoes |
b. The paddle product line only (i.e.,single-product setting)
| BE units | paddles |
3. Cost-Volume-Profit Analysis,Multiple-Product Setting
The hotel's accounting system data show an average sales mix ofapproximately 300 canoes and 1,200 paddles each season.Significantly more paddles are sold relative to canoes because someinexperienced canoe guests accidentally break one or more paddles,while other guests purchase additional paddles as presents forfriends and relatives. In addition, for this multiple-product CVPanalysis, assume the existence of an additional $30,000 of commonfixed costs for a customer service hotline used for both canoe andpaddle customers. Use CVP analysis to calculate the break-evenpoint in units for both the canoe and paddle product lines combined(i.e., the multiple-product setting).
| Canoe BE units | canoes |
| Paddle BE units | paddles |
4. Cost Classification
a. Classify the manufacturing costs, marketing costs, andcustomer service hotline costs either as production costs or periodcosts.
All manufacturing costs are costs. All marketing costs andcustomer hotline costs are costs
b. For the period costs, further classify them into eitherselling expenses or general and administrative expenses.
Marketing costs are selling oriented; therefore, the marketingperiod costs would be further classified as . Customer hotlinecosts relate to the customer service section of the value chain andwould be further classified as .
5. Sensitivity Cost-Volume-Profit Analysis andProduction Versus Period Costs, Multiple- Product Setting
If both the variable and fixed production costs (refer to youranswer to Requirement 1) associated with the canoe product lineincreased by 5% (beyond the estimate from the high-low analysis),how many canoes and paddles would need to be sold in order to earna target income of $96,000? Assume the same sales mix andadditional fixed costs as in Requirement 3.
| Canoe target income units | canoes |
| Paddle target income units | paddles |
6. Margin of Safety
Calculate the hotelâs margin of safety (both in units and insales dollars) for Many Glacier Hotel, assuming the same facts asin Requirement 3, and assuming that it sells 700 canoes and 2,500paddles next year.
total MOS units above total BE units
$ MOS in sales dollars
