MATH 243- Midterm Exam Guide - Comprehensive Notes for the exam ( 20 pages long!)

13 Oct 2017
School
Department
Course
Professor
Document Summary
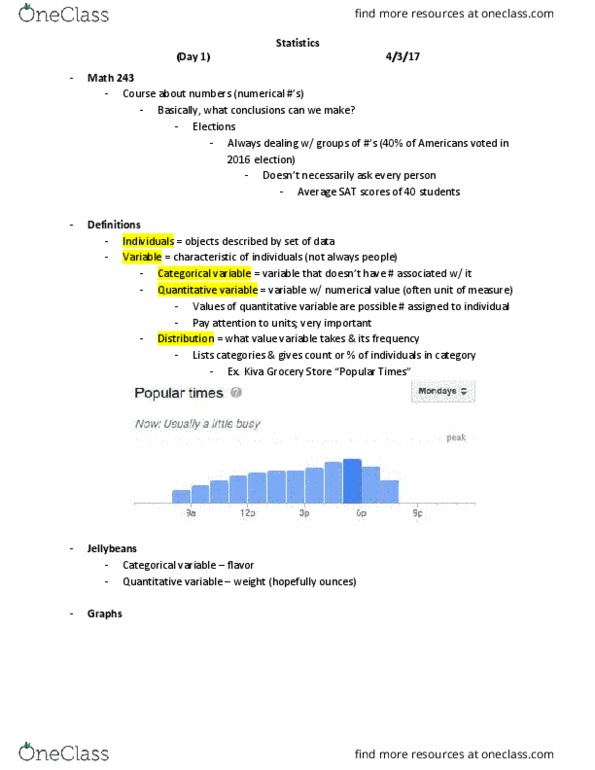
Always dealing w/ groups of #"s (40% of americans voted in. Individuals = objects described by set of data. Variable = characteristic of individuals (not always people) Categorical variable = variable that doesn"t have # associated w/ it. Quantitative variable = variable w/ numerical value (often unit of measure) Values of quantitative variable are possible # assigned to individual. Distribution = what value variable takes & its frequency. Lists categories & gives count or % of individuals in category. Problem: young people are more likely than older folk to buy music online. Here are %"s of people in several age groups who bought music online. Answer: too many variables; pie chart needs to only show 1 variable (day 2) Distribution = listing or function showing all the possible values of data. Median = o(cid:396)de(cid:396) #"s & pick (cid:373)iddle. Percentile = % you are above & % below (70% = scored better than 70% & 30% scored better than you)