FI 413 Study Guide - Final Guide: Current Liability, Accounts Payable, Retained Earnings
14 views3 pages

Get access
Grade+
$40 USD/m
Billed monthly

Homework Help
Study Guides
Textbook Solutions
Class Notes
Textbook Notes
Booster Class
10 Verified Answers
Related Documents

Related Questions
| Joshua & White Technologies: December 31 Balance Sheets | ||||||
| (Thousands of Dollars) | ||||||
| Assets | 2010 | 2009 | ||||
| Cash and cash equivalents | $21,000 | $20,000 | ||||
| Short-term investments | 3,759 | 3,240 | ||||
| Accounts Receivable | 52,500 | 48,000 | ||||
| Inventories | 84,000 | 56,000 | ||||
| Total current assets | $161,259 | $127,240 | ||||
| Net fixed assets | 218,400 | 200,000 | ||||
| Total assets | $379,659 | $327,240 | ||||
| Liabilities and equity | ||||||
| Accounts payable | $33,600 | $32,000 | ||||
| Accruals | 12,600 | 12,000 | ||||
| Notes payable | 19,929 | 6,480 | ||||
| Total current liabilities | $66,129 | $50,480 | ||||
| Long-term debt | 67,662 | 58,320 | ||||
| Total liabilities | $133,791 | $108,800 | ||||
| Common stock | 183,793 | 178,440 | ||||
| Retained Earnings | 62,075 | 40,000 | ||||
| Total common equity | $245,868 | $218,440 | ||||
| Total liabilities and equity | $379,659 | $327,240 | ||||
| Joshua & White Technologies December 31 Income Statements | ||||||
| (Thousands of Dollars) | ||||||
| 2010 | 2009 | |||||
| Sales | $420,000 | $400,000 | ||||
| Expenses excluding depr. and amort. | 327,600 | 320,000 | ||||
| EBITDA | $92,400 | $80,000 | ||||
| Depreciation and Amortization | 19,660 | 18,000 | ||||
| EBIT | $72,740 | $62,000 | ||||
| Interest Expense | 5,740 | 4,460 | ||||
| EBT | $67,000 | $57,540 | ||||
| Taxes (40%) | 26,800 | 23,016 | ||||
| Net Income | $40,200 | $34,524 | ||||
| Common dividends | $18,125 | $17,262 | ||||
| Addition to retained earnings | $22,075 | $17,262 | ||||
| Other Data | 2010 | 2009 | ||||
| Year-end Stock Price | $90.00 | $96.00 | ||||
| # of shares (Thousands) | 4,052 | 4,000 | ||||
| Lease payment (Thousands of Dollars) | $20,000 | $20,000 | ||||
| Sinking fund payment (Thousands of Dollars) | $0 | $0 | ||||
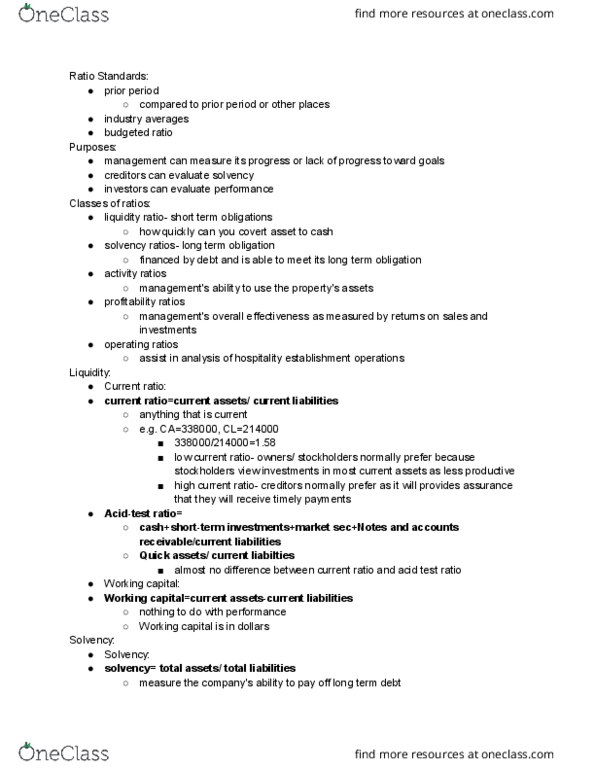
| Ratio Analysis | 2010 | 2009 | Industry Avg | |||
| Liquidity Ratios | ||||||
| Current Ratio | 2.38 | 2.52 | 2.58 | |||
| Quick Ratio | 1.17 | 1.41 | 1.53 | |||
| Asset Management Ratios | ||||||
| Inventory Turnover | 1.11 | 1.22 | 7.69 | |||
| Days Sales Outstanding | 45.63 | 43.80 | 47.45 | |||
| Fixed Assets Turnover | 1.92 | 2.00 | 2.04 | |||
| Total Assets Turnover | 3.81 | 5.64 | 1.23 | |||
| Debt Management Ratios | ||||||
| Debt Ratio | 32.1% | |||||
| Times-interest-earned ratio | 15.33 | |||||
| EBITDA coverage ratio | 4.18 | |||||
| Profitability Ratios | ||||||
| Profit Margin | 9.57% | 8.63% | 8.86% | |||
| Basic Earning Power | 19.16% | 18.95% | 19.48% | |||
| Return on Assets | 10.59% | 10.55% | 10.93% | |||
| Return on Equity | 21.87% | 19.35% | 16.10% | |||
| Market Value Ratios | ||||||
| Earnings per share | NA | |||||
| Price-to-earnings ratio | 10.65 | |||||
| Cash flow per share | NA | |||||
| Price-to-cash flow ratio | 7.11 | |||||
| Book Value per share | NA | |||||
| Market-to-book ratio | 1.72 | |||||
| a. Has Joshua & White's liquidity position improved or worsened? Explain. | ||||||
| The position of JW has worsend because there ration has fallen from 1.41 to 1.17 | ||||||
| b. Has Joshua & White's ability to manage its assets improved or worsened? Explain. | ||||||
| c. How has Joshua & White's profitability changed during the last year? | ||||||
| d. Perform an extended Du Pont analysis for Joshua & White for 2008 and 2009. | ||||||
| ROE = | PM x | TA Turnover x Equity Multiplier | ||||
| 2010 | ||||||
| 2009 | ||||||
| e. Perform a common size analysis. What has happened to the composition | ||||||
| (that is, percentage in each category) of assets and liabilities? | ||||||
| Common Size Balance Sheets | ||||||
| Assets | 2010 | 2009 | ||||
| Cash and cash equivalents | ||||||
| Short-term investments | ||||||
| Accounts Receivable | ||||||
| Inventories | ||||||
| Total current assets | ||||||
| Net fixed assets | ||||||
| Total assets | ||||||
| Liabilities and equity | 2010 | 2009 | ||||
| Accounts payable | ||||||
| Accruals | ||||||
| Notes payable | ||||||
| Total current liabilities | ||||||
| Long-term debt | ||||||
| Total liabilities | ||||||
| Common stock | ||||||
| Retained Earnings | ||||||
| Total common equity | ||||||
| Total liabilities and equity | ||||||
| Common Size Income Statements | 2010 | 2009 | ||||
| Sales | ||||||
| Expenses excluding depr. and amort. | ||||||
| EBITDA | ||||||
| Depreciation and Amortization | ||||||
| EBIT | ||||||
| Interest Expense | ||||||
| EBT | ||||||
| Taxes (40%) | ||||||
| Net Income | ||||||
| f. Perform a percent change analysis. What does this tell you about the change in profitability | ||||||
| and asset utilization? | ||||||
| Percent Change Balance Sheets | Base | |||||
| Assets | 2010 | 2009 | ||||
| Cash and cash equivalents | ||||||
| Short-term investments | ||||||
| Accounts Receivable | ||||||
| Inventories | ||||||
| Total current assets | ||||||
| Net fixed assets | ||||||
| Total assets | ||||||
| Base | ||||||
| Liabilities and equity | 2010 | 2009 | ||||
| Accounts payable | ||||||
| Accruals | ||||||
| Notes payable | ||||||
| Total current liabilities | ||||||
| Long-term debt | ||||||
| Total liabilities | ||||||
| Common stock | ||||||
| Retained Earnings | ||||||
| Total common equity | ||||||
| Total liabilities and equity | ||||||
| Base | ||||||
| Percent Change Income Statements | 2010 | 2009 | ||||
| Sales | ||||||
| Expenses excluding depr. and amort. | ||||||
| EBITDA | ||||||
| Depreciation and Amortization | ||||||
| EBIT | ||||||
| Interest Expense | ||||||
| EBT | ||||||
| Taxes (40%) | ||||||
| Net Income | ||||||

| Joshua & White Technologies: December 31 Balance Sheets | ||||||
| (Thousands of Dollars) | ||||||
| Assets | 2010 | 2009 | ||||
| Cash and cash equivalents | $21,000 | $20,000 | ||||
| Short-term investments | 3,759 | 3,240 | ||||
| Accounts Receivable | 52,500 | 48,000 | ||||
| Inventories | 84,000 | 56,000 | ||||
| Total current assets | $161,259 | $127,240 | ||||
| Net fixed assets | 218,400 | 200,000 | ||||
| Total assets | $379,659 | $327,240 | ||||
| Liabilities and equity | ||||||
| Accounts payable | $33,600 | $32,000 | ||||
| Accruals | 12,600 | 12,000 | ||||
| Notes payable | 19,929 | 6,480 | ||||
| Total current liabilities | $66,129 | $50,480 | ||||
| Long-term debt | 67,662 | 58,320 | ||||
| Total liabilities | $133,791 | $108,800 | ||||
| Common stock | 183,793 | 178,440 | ||||
| Retained Earnings | 62,075 | 40,000 | ||||
| Total common equity | $245,868 | $218,440 | ||||
| Total liabilities and equity | $379,659 | $327,240 | ||||
| Joshua & White Technologies December 31 Income Statements | ||||||
| (Thousands of Dollars) | ||||||
| 2010 | 2009 | |||||
| Sales | $420,000 | $400,000 | ||||
| Expenses excluding depr. and amort. | 327,600 | 320,000 | ||||
| EBITDA | $92,400 | $80,000 | ||||
| Depreciation and Amortization | 19,660 | 18,000 | ||||
| EBIT | $72,740 | $62,000 | ||||
| Interest Expense | 5,740 | 4,460 | ||||
| EBT | $67,000 | $57,540 | ||||
| Taxes (40%) | 26,800 | 23,016 | ||||
| Net Income | $40,200 | $34,524 | ||||
| Common dividends | $18,125 | $17,262 | ||||
| Addition to retained earnings | $22,075 | $17,262 | ||||
| Other Data | 2010 | 2009 | ||||
| Year-end Stock Price | $90.00 | $96.00 | ||||
| # of shares (Thousands) | 4,052 | 4,000 | ||||
| Lease payment (Thousands of Dollars) | $20,000 | $20,000 | ||||
| Sinking fund payment (Thousands of Dollars) | $0 | $0 | ||||
| Ratio Analysis | 2010 | 2009 | Industry Avg | |||
| Liquidity Ratios | ||||||
| Current Ratio | 2.38 | 2.52 | 2.58 | |||
| Quick Ratio | 1.17 | 1.41 | 1.53 | |||
| Asset Management Ratios | ||||||
| Inventory Turnover | 1.11 | 1.22 | 7.69 | |||
| Days Sales Outstanding | 45.63 | 43.80 | 47.45 | |||
| Fixed Assets Turnover | 1.92 | 2.00 | 2.04 | |||
| Total Assets Turnover | 3.81 | 5.64 | 1.23 | |||
| Debt Management Ratios | ||||||
| Debt Ratio | 32.1% | |||||
| Times-interest-earned ratio | 15.33 | |||||
| EBITDA coverage ratio | 4.18 | |||||
| Profitability Ratios | ||||||
| Profit Margin | 9.57% | 8.63% | 8.86% | |||
| Basic Earning Power | 19.16% | 18.95% | 19.48% | |||
| Return on Assets | 10.59% | 10.55% | 10.93% | |||
| Return on Equity | 21.87% | 19.35% | 16.10% | |||
| Market Value Ratios | ||||||
| Earnings per share | NA | |||||
| Price-to-earnings ratio | 10.65 | |||||
| Cash flow per share | NA | |||||
| Price-to-cash flow ratio | 7.11 | |||||
| Book Value per share | NA | |||||
| Market-to-book ratio | 1.72 | |||||
| a. Has Joshua & White's liquidity position improved or worsened? Explain. | ||||||
| The position of JW has worsend because there ration has fallen from 1.41 to 1.17 | ||||||
| b. Has Joshua & White's ability to manage its assets improved or worsened? Explain. | ||||||
| c. How has Joshua & White's profitability changed during the last year? | ||||||
| d. Perform an extended Du Pont analysis for Joshua & White for 2008 and 2009. | ||||||
| ROE = | PM x | TA Turnover x Equity Multiplier | ||||
| 2010 | ||||||
| 2009 | ||||||
| e. Perform a common size analysis. What has happened to the composition | ||||||
| (that is, percentage in each category) of assets and liabilities? | ||||||
| Common Size Balance Sheets | ||||||
| Assets | 2010 | 2009 | ||||
| Cash and cash equivalents | ||||||
| Short-term investments | ||||||
| Accounts Receivable | ||||||
| Inventories | ||||||
| Total current assets | ||||||
| Net fixed assets | ||||||
| Total assets | ||||||
| Liabilities and equity | 2010 | 2009 | ||||
| Accounts payable | ||||||
| Accruals | ||||||
| Notes payable | ||||||
| Total current liabilities | ||||||
| Long-term debt | ||||||
| Total liabilities | ||||||
| Common stock | ||||||
| Retained Earnings | ||||||
| Total common equity | ||||||
| Total liabilities and equity | ||||||
| Common Size Income Statements | 2010 | 2009 | ||||
| Sales | ||||||
| Expenses excluding depr. and amort. | ||||||
| EBITDA | ||||||
| Depreciation and Amortization | ||||||
| EBIT | ||||||
| Interest Expense | ||||||
| EBT | ||||||
| Taxes (40%) | ||||||
| Net Income | ||||||
| f. Perform a percent change analysis. What does this tell you about the change in profitability | ||||||
| and asset utilization? | ||||||
| Percent Change Balance Sheets | Base | |||||
| Assets | 2010 | 2009 | ||||
| Cash and cash equivalents | ||||||
| Short-term investments | ||||||
| Accounts Receivable | ||||||
| Inventories | ||||||
| Total current assets | ||||||
| Net fixed assets | ||||||
| Total assets | ||||||
| Base | ||||||
| Liabilities and equity | 2010 | 2009 | ||||
| Accounts payable | ||||||
| Accruals | ||||||
| Notes payable | ||||||
| Total current liabilities | ||||||
| Long-term debt | ||||||
| Total liabilities | ||||||
| Common stock | ||||||
| Retained Earnings | ||||||
| Total common equity | ||||||
| Total liabilities and equity | ||||||
| Base | ||||||
| Percent Change Income Statements | 2010 | 2009 | ||||
| Sales | ||||||
| Expenses excluding depr. and amort. | ||||||
| EBITDA | ||||||
| Depreciation and Amortization | ||||||
| EBIT | ||||||
| Interest Expense | ||||||
| EBT | ||||||
| Taxes (40%) | ||||||
| Net Income | ||||||
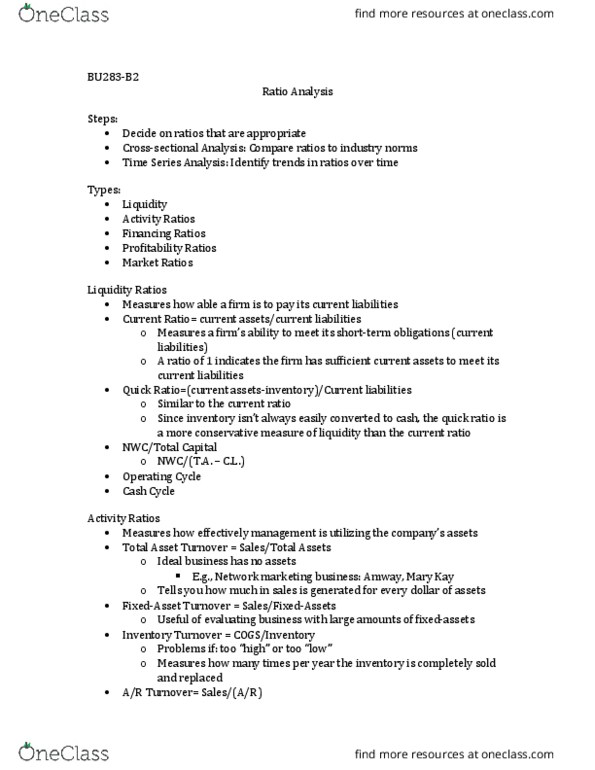
Given the financial statements for Jones Corporation and SmithCorporation:
| JONES CORPORATION | |||||||
| Current Assets | Liabilities | ||||||
| Cash | $ | 22,000 | Accounts payable | $ | 127,000 | ||
| Accounts receivable | 81,100 | Bonds payable (long term) | 85,600 | ||||
| Inventory | 50,000 | ||||||
| Long-Term Assets | Stockholders' Equity | ||||||
| Gross fixed assets | $ | 526,000 | Common stock | $ | 150,000 | ||
| Less: Accumulated depreciation | 150,700 | Paid-in capital | 70,000 | ||||
| Net fixed assets* | 375,300 | Retained earnings | 95,800 | ||||
| Total assets | $ | 528,400 | Total liabilities and equity | $ | 528,400 | ||
| Sales (on credit) | $ | 1,326,000 |
| Cost of goods sold | 790,000 | |
| Gross profit | $ | 536,000 |
| Selling and administrative expenseâ | 304,000 | |
| Depreciation expense | 59,800 | |
| Operating profit | $ | 172,200 |
| Interest expense | 14,500 | |
| Earnings before taxes | $ | 157,700 |
| Tax expense | 99,600 | |
| Net income | $ | 58,100 |
*Use net fixed assets in computing fixed asset turnover.
â Includes $13,500 in lease payments.
| SMITH CORPORATION | |||||||
| Current Assets | Liabilities | ||||||
| Cash | $ | 38,400 | Accounts payable | $ | 83,300 | ||
| Marketable securities | 12,700 | Bonds payable (long term) | 217,000 | ||||
| Accounts receivable | 74,300 | ||||||
| Inventory | 83,700 | ||||||
| Long-Term Assets | Stockholders' Equity | ||||||
| Gross fixed assets | $ | 504,000 | Common stock | $ | 75,000 | ||
| Less: Accumulated depreciation | 255,800 | Paid-in capital | 30,000 | ||||
| Net fixed assets* | 248,200 | Retained earnings | 52,000 | ||||
| Total assets | $ | 457,300 | Total liabilities and equity | $ | 457,300 | ||
*Use net fixed assets in computing fixed asset turnover.
| SMITH CORPORATION | ||
| Sales (on credit) | $ | 1,100,000 |
| Cost of goods sold | 640,000 | |
| Gross profit | $ | 460,000 |
| Selling and administrative expenseâ | 272,000 | |
| Depreciation expense | 56,500 | |
| Operating profit | $ | 131,500 |
| Interest expense | 24,300 | |
| Earnings before taxes | $ | 107,200 |
| Tax expense | 56,500 | |
| Net income | $ | 50,700 |
â Includes $13,500 in lease payments.
a. Compute the following ratios. (Use a360-day year. Do not round intermediate calculations. Input yourprofit margin, return on assets, return on equity, and debt tototal assets answers as a percent rounded to 2 decimal places.Round all other answers to 2 decimal places.)
| |||||||||||||||||||||||||||||||||||||||||||||||||||||||||||||||||||||||
