ECO105Y1 Study Guide - Final Guide: The O.C., Absolute Advantage, Opportunity Cost


ECO105 Exam Study Notes
PART 1. Microeconomics
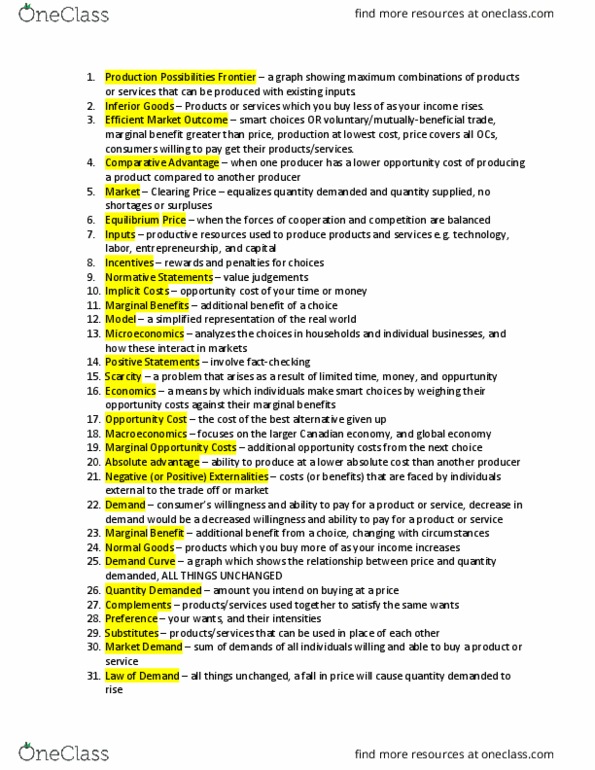
1. - Opportunity cost – the cost of the best alternative given up.
Formula: Give up/Get
- Production Possibility Frontier (PPF) – graph showing the maximum combinations of
products or services produced with existing inputs.
- Absolute Advantage – the ability to produce a product or service at a lower cost than
another producer.
- Comparative Advantage – the ability to produce a product or service at a lower
opportunity cost than another producer.
Example: In an eight-hour day, Andy can produce either 24 loaves of bread or
8 kilograms of butter. In an eight-hour day, Rolfe can produce either 24 loaves of bread or
24 kilograms of butter. Calculate the opportunity cost and state who has comparative or
absolute advantage in production of bread and butter?
Production Possibilities
Bread
Butter
Andy
24
8
Rolfe
24
24
Opportunity cost
Bread
Butter
Andy
3
1/3
Rolfe
1
1
Therefore, the opportunity cost of producing 1 butter is 3 breads for Andy and 1 bread for
Rolfe.
The O.C. of producing 1 bread is 1/3 butter for Andy and 1 butter for Rolfe.
Andy has a comparative advantage in producing bread, while Rolfe has a C.A. in producing
butter.
- In input markets households are sellers and businesses are buyers.
- In output markets businesses are sellers and households are buyers.
- Positive statements – about what it is; can be evaluated as true or false by checking the facts.
- Normative statements – about what you believe should be; involve value judgements; cannot
be factually checked.
- Negative externalities – external costs to society from your private choice that affect others,
but you do not pay. e.g. pollution from factories
- Positive externalities – external benefits to society from your private choice that affect others,
but they do not pa for. e.g. national defence, lighthouses

The rule for a smart choice for any product/service that generates an externality is to choose
the quantity of output where marginal social cost (MSC) = marginal social benefit (MSB).
MSC = marginal private cost + marginal external cost
MSB = marginal private benefit + marginal external benefit
2. - Demand – consumers’ willingness and ability to pay for particular product or service.
- Quantity demanded – the amount you actually plan to buy at a given price.
- Market Demand – the sum of demands of all individuals willing and able to buy a particular
product or service.
- Law of Demand – if the price of a product or service rises, quantity demanded decreases,
other things remaining the same (ceteris paribus).
- Demand Curve – shows the relationship between price and quantity demanded, other
things remaining the same.
- Quantity demanded changes only with a change in price. All other influences on consumer
choice change demand.
- Increase in Demand – increase in consumers’ willingness and ability to pay. Curve shifts
rightward.
- Decrease in Demand – decrease in consumers’ willingness and ability to pay. Curve shits
leftwards.
- Demand increases with:
* increase in preference
* rise in price of a substitute
* fall in price of a complement
* increase in income for normal goods (products you buy more often when income
increases)
* decrease in income for inferior goods (products you buy less when income increases)
* rise in expected future prices
* increase in number of consumers
3. - Marginal benefits – additional benefits from the next choice.
- Marginal opportunity costs – additional opportunity costs from the next choice.
- Implicit Costs – opportunity costs of investing your own money or time.
- Rule is to get an additional product/service if the marginal benefit of that product/service is
greater than its marginal cost.
- For supply, MC increases as you supply more.
- For demand, MB decreases as you buy more.
- For supply, MB is measured in $ (wages you earn); marginal cost is the opportunity cost of
time.
- For demand, marginal benefit is the satisfaction you get; marginal cost is measured in $
(the price you pay).
- Sunk Costs – past expenses that cannot be recovered.
- Supply – businesses’ willingness to produce a particular product or service because price

covers all opportunity costs.
- Quantity Supplied – quantity you actually plan to supply at a given price.
- Marginal Opportunity Cost – complete term for any cost relevant to a smart decision.
- Increasing marginal opportunity costs arise because inputs are not equally productive in all
activities. (When they are equally productive OC is constant).
- Market Supply – sum of supplies of all businesses willing to produce a particular product or
service.
- Law of Supply – if the price of a product or service rises, quantity supplied increases.
- Supply Curve – shows the relationship between price and quantity supplied, other things
remaining the same.
- Quantity Supplied is changed only with a change in price.
- Decrease in Supply – decrease in businesses’ willingness to supply.
- Increase in Supply – increase in businesses’ willingness to supply. At any unchanged price,
businesses are now willing to supply a greater quantity. For producing any unchanged quantity,
businesses are now willing to accept a lower price.
- Supply increases with:
* improvement in technology
* environmental change helping production
* fall in price of an input
* fall in price of a related product or service
* fall in expected future price
* increase in number of businesses
4. - Market – the interaction between buyers and sellers.
- Property Rights – legally enforceable guarantees of ownership of physical, financial and
intellectual property.
- When there are shortages, competition between buyers drives prices up. When there are
surpluses, competition between sellers drives prices down.
- Elimination of shortages – businesses increase quantity supplied, consumers decrease
quantity demanded.
- Elimination of surpluses – businesses decrease quantity supplied, consumers increase
quantity demanded.
- Market-clearing price – the price that equalizes quantity demanded and quantity supplied.
- Equilibrium price – the price that balances forces of competition and cooperation, so that
there is no tendency to change.
- Increase in demand causes a rise in the equilibrium price, and an increase in quantity
supplied.
- Decrease in demand causes a fall in the equilibrium price, and a decrease in quantity
supplied.
- Increase in supply causes a fall in the equilibrium causes a fall in the equilibrium price and
an increase in quantity demanded.
- Decrease in supply causes a rise in the equilibrium price and a decrease in quantity
demanded.
- Comparative Statistics – comparing two equilibrium outcomes to isolate the effect of