QMS 102 Study Guide - Midterm Guide: Quartile, Bar Chart, Central Tendency

7 Jun 2017
School
Department
Course
Professor


Document Summary
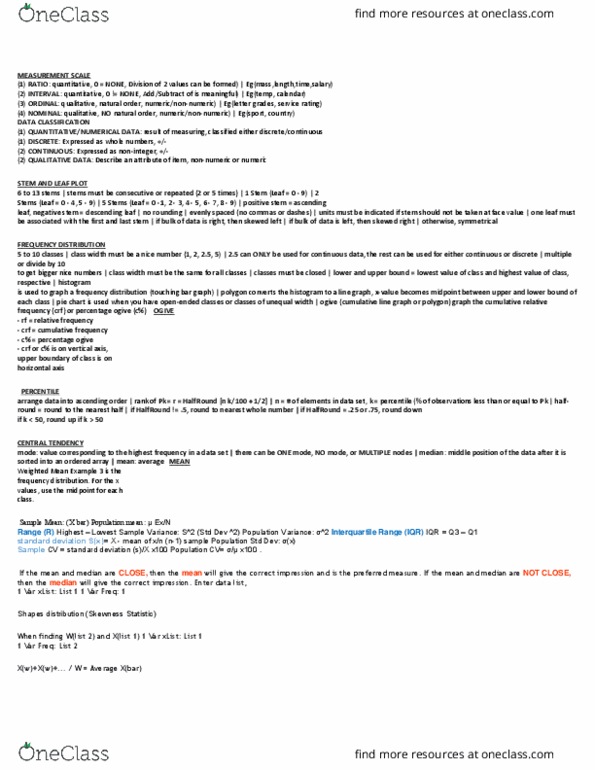
Interval: 0 does not mean nothing, only permits mathematical operation of addition and subtraction. A type of vertical bar chart, descending rank order of magnitude of their frequency: pareto chart. Distance from q1 to q2 is less than distance from q2 to q3 mean > median. Mean: average (add up all number divide the # of number available) Median: middle number ( 1,2,3,4,5) median is 3, if there"s two find the mean of these two. Range: the difference between highest and lowest value (9-1=8) 25th percentile = p25 = q1 = first quartile. 50th percentile = p50 = q2 = second quartile = the median outer fence= (iqr x 3) q1. 75th percentile = p75 = q3 = third quartile left inner fence= (iqr x 1. 5)- q1. Is the standard deviation for a population, which is the same as s for the sample. Is the mean for the population, which is the same as xbar in the sample.