FIN 300 Final: CRIB SHEET- FIN300 EXAM
503 views4 pages

2 Nov 2015
School
Department
Course
Professor


Get access
Grade+20% off
$8 USD/m$10 USD/m
Billed $96 USD annually

Homework Help
Study Guides
Textbook Solutions
Class Notes
Textbook Notes
Booster Class
40 Verified Answers
Related Documents
Related Questions
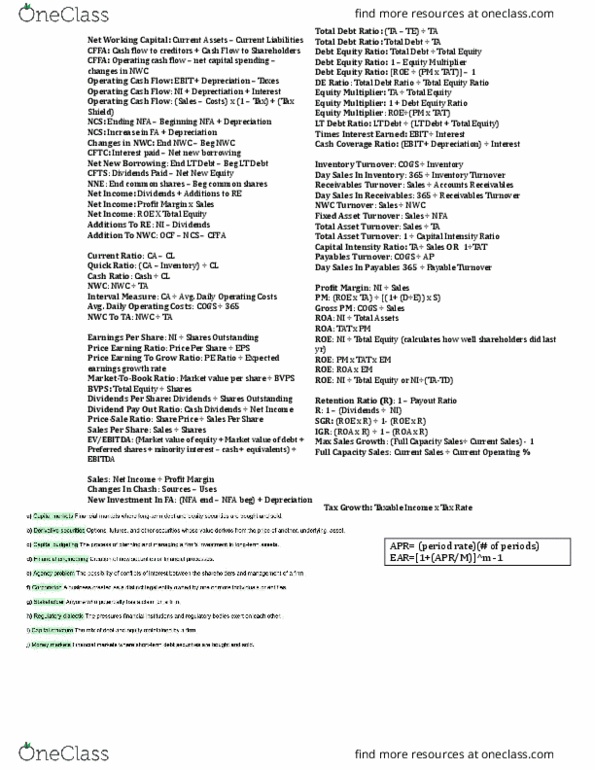
Please check and make sure all of these are correct. Only need 2015
Current ratio= CA/CL
2015: 63278000/65272000 = 0.97
Total debt ratio= TD/TA=(TA-TE)/TA;
2015: (203706000-85937000)/203706000 = 0.57
TIE=EBIT/Interest;
2015: 27147000/2461000 = 11.03
Cash coverage ratio=(EBIT+ Depreciation)/Interest
2015: (27147000+5,390,000)/2,461,000 = 13.22 times
Receivable turnover=sales/AR
2015: 482229000/6778000 = 71.14
Days sales in receivables=365/receivable turnover
2015: 365/74.14=4.92 days
PM=NI/sales
2015: 16363000/482229000 = 0.03
TAT=sales/TA
2015: 482229000/203706000 = 2.36
ROA=NI/TA
2015: 16363000/203706000 = 0.08
ROE=NI/OE
2015: 16363000/71394000=0.2292
| Wal-Mart Stores, Inc. (NYS: WMT) | |||
| Balance Sheet | |||
| Exchange rate used is that of the Year End reported date | |||
| As Reported Annual Balance Sheet | |||
| Report Date | 01/31/2015 | 01/31/2014 | 01/31/2013 |
| Currency | USD | USD | USD |
| Audit Status | Not Qualified | Not Qualified | Not Qualified |
| Consolidated | Yes | Yes | Yes |
| Scale | Thousands | Thousands | Thousands |
| Cash & cash equivalents | 9135000 | 7281000 | 7781000 |
| Receivables, net | 6778000 | 6677000 | 6768000 |
| Inventories | 45141000 | 44858000 | 43803000 |
| Prepaid expenses & other current assets | 2224000 | 1909000 | 1588000 |
| Current assets of discontinued operations | - | 460000 | - |
| Total current assets | 63278000 | 61185000 | 59940000 |
| Land | 26261000 | 26184000 | 25612000 |
| Buildings & improvements | 97496000 | 95488000 | 90686000 |
| Fixtures & equipment | 45044000 | 42971000 | 40903000 |
| Transportation equipment | 2807000 | 2785000 | 2796000 |
| Construction in progress | 5787000 | 5661000 | 5828000 |
| Property & equipment, at cost | 177395000 | 173089000 | 165825000 |
| Less: accumulated depreciation | 63115000 | 57725000 | 51896000 |
| Property & equipment, net | 114280000 | 115364000 | 113929000 |
| Property under capital leases | 5239000 | 5589000 | 5899000 |
| Less: accumulated amortization | 2864000 | 3046000 | 3147000 |
| Property under capital leases, net | 2375000 | 2543000 | 2752000 |
| Goodwill | 18102000 | 19510000 | 20497000 |
| Other assets & deferred charges | 5671000 | 6149000 | 5987000 |
| Total assets | 203706000 | 204751000 | 203105000 |
| Short-term borrowings | 1592000 | 7670000 | 6805000 |
| Accounts payable | 38410000 | 37415000 | 38080000 |
| Accrued wages & benefits | 4954000 | 4652000 | 5059000 |
| Self-insurance | 3306000 | 3477000 | 3373000 |
| Accrued taxes | 2592000 | 2554000 | 2851000 |
| Other accrued liabilities | 8300000 | 8110000 | 7525000 |
| Accrued liabilities | 19152000 | 18793000 | 18808000 |
| Accrued income taxes | 1021000 | 966000 | 2211000 |
| Long-term debt due within one year | 4810000 | 4103000 | 5587000 |
| Obligations under capital leases due within one year | 287000 | 309000 | 327000 |
| Current liabilities of discontinued operation | - | 89000 | - |
| Total current liabilities | 65272000 | 69345000 | 71818000 |
| Unsecured debt | 45443000 | 45073000 | 42882000 |
| Other debt | 453000 | 801000 | 1099000 |
| Total long-term debt | 45896000 | 45874000 | 43981000 |
| Less: current portion | 4810000 | 4103000 | 5587000 |
| Long-term debt | 41086000 | 41771000 | 38394000 |
| Long-term obligations under capital leases | 2606000 | 2788000 | 3023000 |
| Deferred income taxes & other liabilities | 8805000 | 8017000 | 7613000 |
| Redeemable noncontrolling interest | - | 1491000 | 519000 |
| Common stock | 323000 | 323000 | 332000 |
| Capital in excess of par value | 2462000 | 2362000 | 3620000 |
| Retained earnings (accumulated deficit) | 85777000 | 76566000 | 72978000 |
| Currency translation & other | -6355000 | -2722000 | 47000 |
| Derivative instruments | -134000 | 336000 | 129000 |
| Minimum pension liability | -679000 | -610000 | -763000 |
| Accumulated other comprehensive income (loss) | -7168000 | -2996000 | -587000 |
| Total Walmart shareholders' equity | 81394000 | 76255000 | 76343000 |
| Noncontrolling interests | - | 5084000 | 5395000 |
| Nonredeemable noncontrolling interest | 4543000 | - | - |
| Total equity | 85937000 | 81339000 | 81738000 |
| Income Statement | |||
| Exchange rate used is that of the Year End reported date | |||
| As Reported Annual Income Statement | |||
| Report Date | 01/31/2015 | 01/31/2014 | 01/31/2013 |
| Currency | USD | USD | USD |
| Audit Status | Not Qualified | Not Qualified | Not Qualified |
| Consolidated | Yes | Yes | Yes |
| Scale | Thousands | Thousands | Thousands |
| Net sales | 482229000 | 473076000 | 466114000 |
| Membership & other income | 3422000 | 3218000 | 3048000 |
| Total revenues | 485651000 | 476294000 | 469162000 |
| Cost of sales | 365086000 | 358069000 | 352488000 |
| Operating, selling, general & administrative expenses | 93418000 | 91353000 | 88873000 |
| Operating income (loss) | 27147000 | 26872000 | 27801000 |
| Interest expense on debt | 2161000 | 2072000 | 1977000 |
| Interest expense on capital leases | 300000 | 263000 | 274000 |
| Interest income | 113000 | 119000 | 187000 |
| Interest income (expense), net | -2348000 | -2216000 | -2064000 |
| Income (loss) from continuing operations before income taxes & minority interest - United States | 18610000 | 19412000 | 19352000 |
| Income (loss) from continuing operations before income taxes & minority interest - international | 6189000 | 5244000 | 6385000 |
| Income (loss) from continuing operations before income taxes | 24799000 | 24656000 | 25737000 |
| Current federal income taxes provision (benefit) | 6165000 | 6377000 | 5611000 |
| Current state & local income taxes provision (benefit) | 810000 | 719000 | 622000 |
| Current international income taxes provision (benefit) | 1529000 | 1523000 | 1766000 |
| Current provision (benefit) for income taxes | 8504000 | 8619000 | 7999000 |
| Deferred federal income taxes provision (benefit) | -387000 | -72000 | 38000 |
| Deferred state & local income taxes provision (benefit) | -55000 | 37000 | -8000 |
| Deferred international income taxes provision (benefit) | -77000 | -479000 | -48000 |
| Deferred provision (benefit) for income taxes | -519000 | -514000 | -18000 |
| Provision (benefit) for income taxes | 7985000 | 8105000 | 7981000 |
| Income (loss) from continuing operations | 16814000 | 16551000 | 17756000 |
| Income (loss) from discontinued operations, net of income taxes | 285000 | 144000 | - |
| Consolidated net income (loss) | 17099000 | 16695000 | 17756000 |
| Less consolidated net income attributable to noncontrolling interest | -736000 | -673000 | -757000 |
| Consolidated net income attributable to Walmart | 16363000 | 16022000 | 16999000 |
| Weighted average shares outstanding - basic | 3230000 | 3269000 | 3374000 |
| Weighted average shares outstanding - diluted | 3243000 | 3283000 | 3389000 |
| Year end shares outstanding | 3228000 | 3233000 | 3314000 |
| Income (loss) per share-continuing operations - basic | 5.01 | 4.87 | 5.04 |
| Income (loss) per share-discontinued operations - basic | 0.06 | 0.03 | - |
| Net income (loss) per share - basic | 5.07 | 4.9 | 5.04 |
| Income (loss) per share-continuing operations - diluted | 4.99 | 4.85 | 5.02 |
| Income (loss) per share-discontinued operations - diluted | 0.06 | 0.03 | - |
| Net income (loss) per share - diluted | 5.05 | 4.88 | 5.02 |
| Dividends declared per common share | 1.92 | 1.88 | 1.59 |
| Total number of employees | 2200000 | 2200000 | 2200000 |
| Number of common stockholders | 249876 | 255758 | 263499 |


