Checkpoint 4: Puerto Rico's Future - Faith Owens
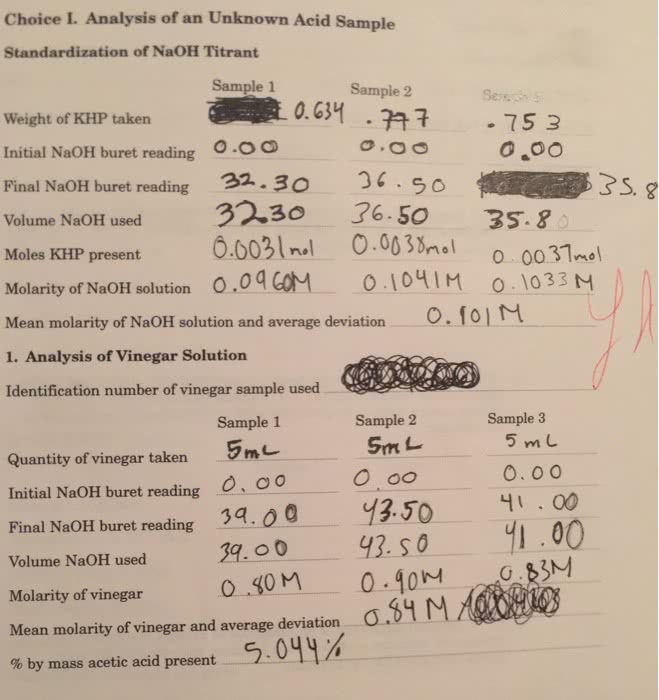
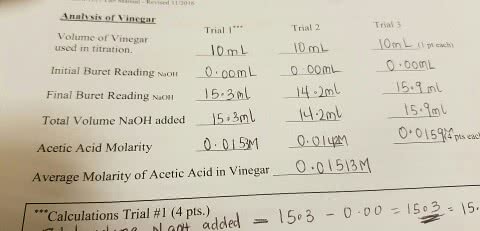
(1) using the molar it yet of acetic acid in vinegar, calculate the mass percent of acetic acid in the original sample. assume the density of vinegar is 1.0g/mL. ( formula for acetic acid is C2H4O2) (2)look up the % acetic acid on a bottle of vinegar in your cabinet or at the Store? (b) what is is the percent error of your experimental determination from the actual on the bottle? (formula for percent error : accepted-experiemental/ accepted Ã100. (3)if your standardized NaOH were used to titration 20.00mL of sulfuric acid (H2SO4), a diproticacid,what concentration of sulfuric acid would you determine if 24.66mL of the NaOH solution were required by the titration? first write the balanced equation for the reaction so as to use the correct stoichiometry in the calculation.
Can someone help me with 11 , 12, and 13? I am confused on the setup
Question 408 pt 1 URGENT
Solve for the molarity of NaOh, mass of KHP in Unknown, and the percent of KHP in unknown.
**URGENT** due in a few hours. Please do all of the parts. Directions are in the picture
Since 2014, the United Nations has conducted annual studies that measure the level of happiness among its member countries. Experts in social science and psychology are commissioned to collect relevant data and define measurements related to happiness. Happiness measurements are based on survey questions such as how people feel about their life (i.e. life ladders) levels of positive and negative emotion, freedom to make choices (life choices) and aggregated indicators such as social support, life expectancy, and relative household income. These data are converted into numerical scores for each member country. The accompanying table shows a portion of the United Nation's happiness data.
c-1. Display the weights used to compute the first principal component scores. (Round your final answers to 4 decimal places.)
c-2. Which original variable is given the highest weight to compute the second principal component?
d. What is the principal component 1 score for the first record (Albania)? (Round your final answer to 4 decimal places.)
*****URGENT****** due in a few hours. Please help
A national bank has developed a predictive model for identifying customers who are more likely to accept a credit card offer. If a customer is predicted to accept the credit card offer, he or she is classified into Class 1; otherwise, he or she is classified into Class 0 . Applying the model to the validation data set generated a table that lists the actual class membership and predicted Class 1 probability of the 100 observations in the validation data set. A portion of the table is shown below.
b.1. Compute the misclassification rate, accuracy rate, sensitivity, precision, and specificity of the classification model for the cutoff value of 0.25. (Round your final answers to 2 decimal places.)
b-2. Compute the misclassification rate, accuracy rate, sensitivity, precision, and specificity of the classification model for the cutoff value of 0.50. (Round your final answers to 2 decimal places.)
b-3. Compute the misclassification rate, accuracy rate, sensitivity, precision, and specificity of the classification model for the cutoff value of 0.75. (Round your final answers to 2 decimal places.)
c-1. Create a cumulative lift chart for the classification modes. At 60 cases, what is the cumulative response using the sorted predicted values?
c-2. Crease a decile wise lift chart for the classification model. What is the lift value of the first decile?
d. What is the lift that the classification model provides if 20% of the observations are selected by the model compared to randomly selecting 20% of the observations? (Round your final answer to 2 decimal places)
e. What is the it that the classification model provides 50% of the observations are selected by the model compered so randomly selecting 50 s of the observations? (Round your final answer to 2 decimal places)
***URGENT**** These are answered. Please let me know if my answers are right, and if they are wrong please answer with the correct answers. There are multiple parts. I need the answers within a couple hours.
Consider the following portion of data that lists the starting salaries (in $ 1000) of newly hired employees and their college GPAs:
a. Without transforming the values, compute the Euclidean distance for all possible pairs of the first three employees. (Round immediate calculations to at least 4 decimal places and your final answers to 2 decimal places.)
b-1. Compute the z-score standardized salaries and Ga4s for the first three employees. (Round intermediate calculations to at least 4 decimal places and your final answers to 2 decimal places. Negative values should be indicated by a minus sign.)
b-2. Based on the z-score standardized salaries and GPAs, compute the Euclidean distance for al possible pairs of the first three employees. (Round intermediate calculations to at least 4 decimal places and your final answers to 2 decimal places.)
c-1. Based on the z-score standardized salaries and GPAs, compute the Manhattan distance for al possible pairs of the first three employees. (Round intermediate calculations to at least 4 decimal places and your final answers to 2 decimal places.)


 and
and  ) an e target variable (y).


 )
) )
)