pokothometrics

pokothometrics

Lv1

PoksUniversity of Pennsylvania

1 Follower
1 Following
1 Helped
I am a talented Economics, Econometrics and Statistics tutor with 2 years experience tutoring experience at university level. I completed Economics Masters with Econometrics s...

ANSWERS

Published28

Subjects

Statistics27Economics1
Answer: Step-by-step explanation:Can you explain in full the terms in your que...
Please the solution attached below the pdf file and the excel file with workin...
Please find the solution attached below.
1. Population is the total number of patients. The sample is 100 patients who ...
Kindly find the R-script which contains the code for the solutions and the req...
Find the solution attached below.
(14 marks) Fortune magazine publishes a list of the world’s billionaires each year. We will examine the top 97 of the 1992 list. Their wealth, age, and geographic location (Asia, Europe, Middle East, United States, and Other) are reported. Wealth is a right-skewed variable, so we will consider the natural logarithm log wealth to be the response and will see if age and geographic location are predictors.
(a) (2 marks) Let
Ebe a variable that is 1 if the person is from Europe and 0 otherwise,
Mbe a variable that is 1 if the person is from the Middle East and 0 otherwise,
Obe a variable that is 1 if the person is from the “Other” region and 0 otherwise,
and
Ube a variable that is 1 if the person is from the United States and 0 otherwise.
State a linear model for the mean of log wealth that includes age and the above 4
geographic variables. Call this the full model.
(b) (5 marks) The SSY for these data is 28.3351 and the SSE from fitting the full model
is 27.0461. Use this information to construct an ANOVA table. Your table should
include columns for Source, df, SS, MS and F, and should include rows for the model
(full model), residual and total.
(c) (2 marks) In addition to the full model, the reduced model that includes only an
intercept and age is fit. What is the null hypothesis being considered by fitting these
two models? (Refer to quantities defined in your model.)
(d) (3 marks) The SSM from the reduced model is 59.7. Calculate an F-statistic to test the hypothesis of part (c). State the degrees of freedom for the F-distribution
you would compare this statistic to. (You do not need to calculate the p-value or actually test the hypothesis.)
(e) (1 mark) Using terminology from class, name the kind of Ftest that the statistic in part (d) corresponds to.
(f) (1 mark) If the null model for these data is compared to the model that includes an
intercept and age, what are the results?
(a) Full model for the log of wealth. Note that the dummy for geographic locat...
Find attached the solutions.
Find the solution attached.

2. (12 marks) In a study of 85 individuals, food questionnaires were used to measure the change in polyunsaturated fatty acids (PUFA) intake from the beginning to the end of the study. In addition researchers measured a genetic marker in the TNF-αgene; for this analysis, we will take the two values of this TNF-αvariable to be A- or A+. The researchers also collected information on gender, age and BMI. The primary question of interest is whether TNF-αmodifies the effect of PUFA on HDL.
 
(a) (1 mark) Let TNFa be a variable with value 1 for A+ and 0 for A- TNF-αstatus and
let gender be 1 for males and 0 for females. State a linear model for mean change in HDL that includes the predictors PUFA, TNFa, PUFA×TNFa interaction, and effects for gender, age and BMI.
(b) (1 mark) A summary of the fitted model is:
                     Estimate       Std. Error   t value     Pr(>|t|)
(Intercept)     0.037531      0.196980   0.191     0.8494
pufa              0.019143      0.009245    2.071      0.0417
TNFa              0.074433      0.034128   2.181      0.0322
gender          -0.008988      0.031793   -0.283     0.7781
age               -0.003895      0.002156   -1.806     0.0747
bmi                0.006777      0.004332    1.565      0.1217
pufa:TNFa      -0.024575      0.017844  -1.377      0.1724
Write a short sentence to describe why we would even consider removing gender from the model (i.e., why we would not just be happy with the above model from
the outset).
 
(c) (2 marks) Below is a summary of the model fit without gender. Using our 10% rule-of-thumb, is there any evidence that gender confounds the PUFA×TNFa effect?
If so why, if not why not?
                        Estimate     Std. Error      t value       Pr(>|t|)
(Intercept)       0.024467     0.190364      0.129         0.8981
pufa                0.018841     0.009130      2.064         0.0423
TNFa               0.074850     0.033897      2.208         0.0301
age                -0.003783     0.002107    -1.795         0.0765
bmi                 0.006835     0.004301     1.589          0.1161
pufa:TNFa       -0.024496     0.017737   -1.381          0.1712
 
(d) (2 marks) The researchers decided to use the model with PUFA, TNFa, PUFA×TNFa, age and BMI for inference of PUFA×TNFa interaction. What are the degrees of
freedom for the t-distribution whose critical value we need to construct confidence intervals for the interaction? What upper tail probability should you use for a 95%
confidence interval?
(e) (1 mark) The appropriate critical value is 1.96. Construct a 95% confidence interval for the interaction.
(f) (2 marks) State the null hypothesis and a two-sided alternative hypothesis for testing whether TNFa modifies the effect of PUFA on HDL.
(g) (1 mark) From the computer output, what is the p-value for this test?
(h) (2 marks) For fixed age and BMI, what is the estimated effect of a one-unit change in PUFA for a subject who is A- at TNF-α? For fixed age and BMI, what is the estimated effect of a one-unit change in PUFA for a subject who is A+ at TNF-α.
(a) (b) One would not be unhappy will the regression output from the fact that...
If the binomial distribution is found to be relevant but n is large and p is s...
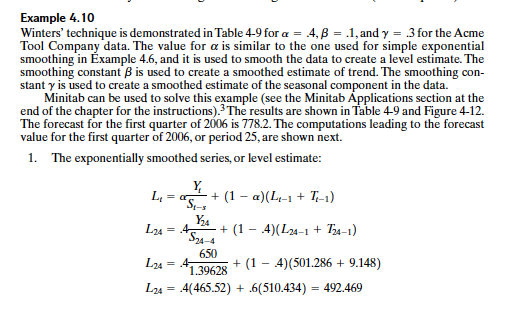
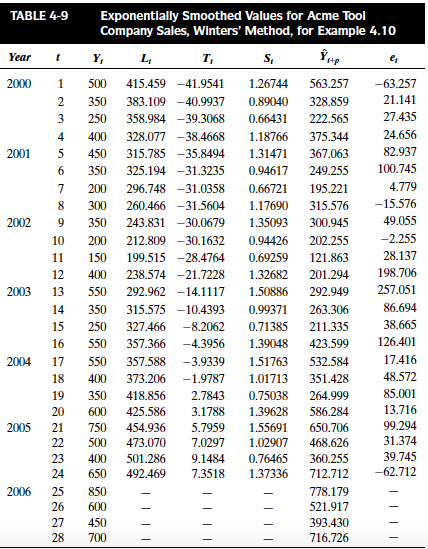
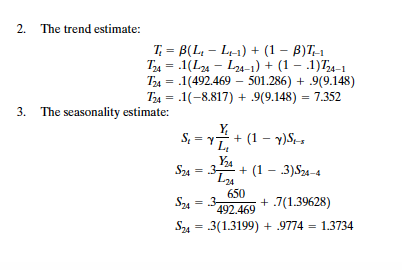
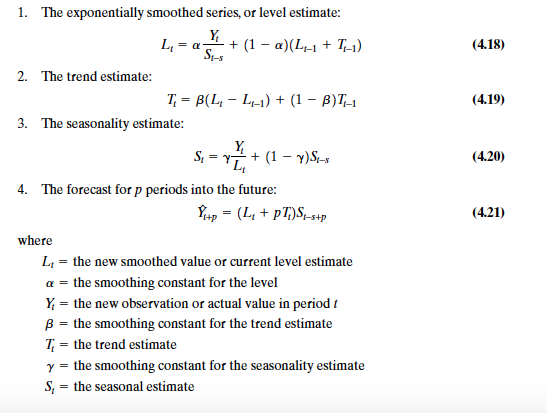
1. When t=25 Using the given formulas substituting: Exponential estimate Trend...
a) From the experiment 1, we see that out of the people who want to quit to sm...
7. a. To find the total number of different committees, we use the concept of ...
(a) The given probability space ,consists of the main elements: 1. represents ...
Since the sample size, n=300 is large, the Normal distribution assumption hold...
This question seems to have missing information. Thus, it's not clear and can'...
3. Show that the given probability is true The natural behaviour that the Rand...
The variable will be created as follows:
a) Population mean is equal to the sample mean of 55.40 mpg, because the sampl...
Find R the code attache below together with the report for the results.
(a) The level of measurement is ORDINAL LEVEL since the levels of satisfaction...
Please find the R-script for cleaning the data to prepare the data ready for a...
Kindly find the solution attached below.
The equation for the line of best fit is given as: The coffee sales is a depen...
To calculate the power of the test, the hypothesis test of the difference betw...
a) Break-even in terms of output is $60,000. In term of sales revenue, break-e...
2. (a) It is explicitly stated that in the first row, a red ball is drawn firs...

Weekly leaderboard

Start filling in the gaps now
Log in