The s-t graph shown in the figure represents:
For unlimited access to Homework Help, a Homework+ subscription is required.
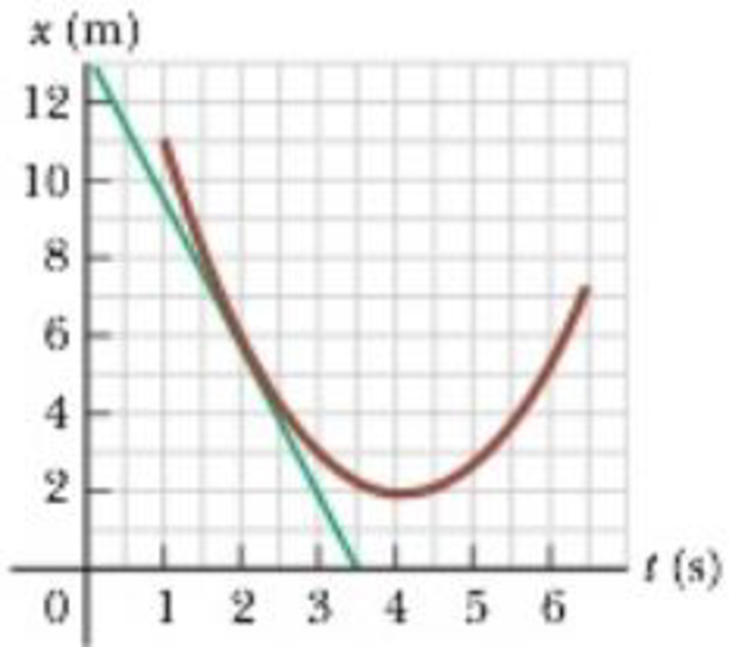
A position-time graph for a particle moving along the x-axis is shown in Figure P2.5. (a) Find the average velocity in the time interval t = 1.50 s to t = 4.00 s. (b) Determine the instantaneous velocity at t = 2.00 s by measuring the slope of the tangent line shown in the graph. (c) At what value of t is the velocity zero?
Figure P2.5
The displacement versus time graph for a body moving in a straight line is shown in figure. Which of the following regions represents the motion when no force acting on the body:
An object's acceleration graph is shown in the figure. Its velocity at t=0 s is vx = 2.0 m/s. How does velocity graph look like?