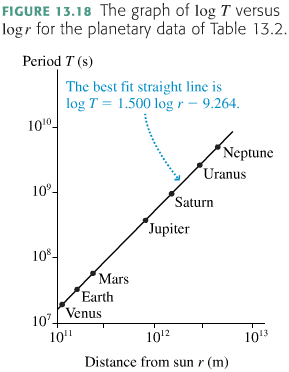
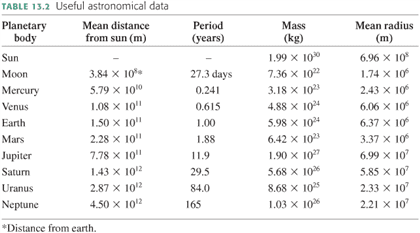
Figure 13.18 shows the periods of planets in our solar systemvs. their orbital radii on a log-log scale. Curiously, the datapoint for the Moon is not in that figure. If we added the Moon tothe graph, where would it be relative to the straight line? Theastronomical data for the Moon are listed in Table 13.2.
Note: for the Moon, the horizontal axis is the distance from earth,not from sun.
A) On the straight line. B) Above the straight line. C) Below the straight line.