What combination of the two goods below allows you to maximize your utility with a budget constraint of $14? Show how you arrived at your conclusion in the space provided below. Place your final answers on the lines at the bottom of this page.
PRICE = $0.50 per pint
Bottles of glue
Total Utility (Utils)
1
15
2
23
3
30
4
35
5
38
6
40.5
PRICE = $2.00 per box
Bales of hay
Total Utility (Utils)
1
10
2
22
3
36
4
52
5
70
6
90
Bottles of glue: _________________________
Bales of hay: ____________________________
What combination of the two goods below allows you to maximize your utility with a budget constraint of $14? Show how you arrived at your conclusion in the space provided below. Place your final answers on the lines at the bottom of this page.
PRICE = $0.50 per pint
| Bottles of glue | Total Utility (Utils) |
| 1 | 15 |
| 2 | 23 |
| 3 | 30 |
| 4 | 35 |
| 5 | 38 |
| 6 | 40.5 |
PRICE = $2.00 per box
| Bales of hay | Total Utility (Utils) |
| 1 | 10 |
| 2 | 22 |
| 3 | 36 |
| 4 | 52 |
| 5 | 70 |
| 6 | 90 |
Bottles of glue: _________________________
Bales of hay: ____________________________

Related textbook solutions


Related questions
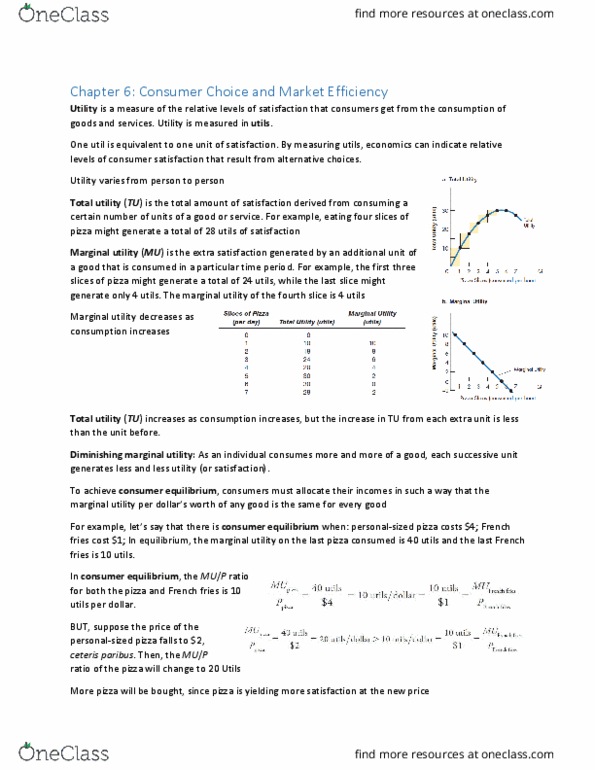
1. Use the table below for the following question. Suppose you have a budget of $6 and that brownies and Twizzlers cost $1 each. What is the consumer optimum?
|
Number of Brownies |
Total Utility of Brownies |
Marginal Utility of Brownies |
Number of Twizzlers |
Total Utility of Twizzlers |
Marginal Utility of Twizzlers |
|
0 |
0 |
- |
0 |
0 |
- |
|
1 |
10 |
10 |
1 |
6 |
8 |
|
2 |
19 |
9 |
2 |
13 |
7 |
|
3 |
26 |
7 |
3 |
19 |
6 |
|
4 |
30 |
4 |
4 |
23 |
4 |
|
5 |
30 |
0 |
5 |
25 |
2 |
|
6 |
29 |
-1 |
6 |
25 |
0 |
| 6 brownies |
| 3 brownies and 3 Twizzlers |
| 4 brownies and 2 Twizzlers |
| any combination of 6 because they're both $1 |
| 8 |
2. Use the table below for the following question. What is the consumer equilibrium for a $6 budget if the price of brownies rises to $1.50 and the price of Twizzlers remains at $1.00?
|
Number of Brownies |
Total Utility of Brownies |
Marginal Utility of Brownies |
Number of Twizzlers |
Total Utility of Twizzlers |
Marginal Utility of Twizzlers |
|
0 |
0 |
- |
0 |
0 |
- |
|
1 |
10 |
10 |
1 |
6 |
8 |
|
2 |
19 |
9 |
2 |
13 |
7 |
|
3 |
26 |
7 |
3 |
19 |
6 |
|
4 |
30 |
4 |
4 |
23 |
4 |
|
5 |
30 |
0 |
5 |
25 |
2 |
|
6 |
29 |
-1 |
6 |
25 |
0 |
| The consumer will buy all Twizzlers because they're cheaper. |
| 4 brownies |
| 3 Twizzlers and 2 brownies |
| 3 brownies and 3 Twizzlers |
| 7 |
3. At Nice Price for the Ice, an ice cream parlor, customers routinely buy a scoop of ice cream for $3. If consumers purchase one scoop of ice cream at $3, then why don't they keep buying more and more scoops for $3 until the store sells out?
| People would not want more than one scoop of ice cream because then they would have less money to spend on other goods. |
| People do not want to consume all the scoops of ice cream because their total utility is higher the less they eat. |
| At some point, customers do not value an additional scoop at $3, so they will not pay $3 for a scoop after they reach that point. |
4. Suppose you plan on eating 50 potato chips. As you start consuming potato chips, your marginal utility is very high, but it begins to fall slowly until you've eaten 10 chips. After you have eaten 10 chips, your marginal utility decreases even faster with each additional chip. The marginal utility continues to decline until you've eaten 49 chips. The fiftieth chip does not give you any additional utility. After 50 chips, your mouth gets so salty that it's unpleasant to eat anymore, so marginal utility is actually negative for those chips. How many chips should you eat in order to maximize your total utility?
| 1 |
| 10 |
| 49 |
5. As you start consuming potato chips, your marginal utility is very high, but it begins to fall slowly until you've eaten 10 chips. After you have eaten 10 chips, marginal utility decreases even faster with each additional chip. The marginal utility continues to decline until you've eaten 49 chips. The fiftieth chip does not give you any additional utility. After 50 chips, your mouth gets so salty that it's unpleasant to eat anymore, so marginal utility is actually negative for those chips. How many chips should you eat in order to maximize your marginal utility?
| 1 |
| 10 |
| 49 |
| 50 |
6. At current levels of consumption, Alice is spending her entire budget. If Alice gets 3 utils of satisfaction per dollar spent on ice cream and 2 utils per dollar spent on shampoo, then how should she adjust her consumption to get closer to the consumer optimum?
| She is already at the consumer optimum, so no adjustment is necessary. |
| She should buy more ice cream and less shampoo. |
| She should buy more shampoo and less ice cream. |
| She should buy more of both goods. |
7. Suppose you are at a restaurant and your favorite dish costs $20. You can get your next-favorite dish for $17. If your next-favorite dish gives you 100 utils, how many additional utils do you need from your favorite dish to spend the extra $3?
| 15 |
| 17.65 |
| 85 |
| 117.65 |
8. The diamond water paradox is the observation that water is essential to life and inexpensive, while diamonds are not essential and are highly-priced. Which of the other pairs of goods exhibit a pricing structure similar to water and diamonds?
| economy & luxury cars |
| rice & truffles (very expensive mushrooms) |
| paper clips & gasoline |
| paper & textbooks |
9. Rice is a cheap staple food eaten several times a day by many people all over the world. In Trufflelandia, residents also eat expensive mushrooms known as truffles once every year as a birthday celebration. Rice keeps the people alive and truffles are not necessary for sustaining their lives. Why is rice so cheap and truffles so expensive?
| Truffles taste better, so they are worth more money. |
| Rice is easy to cook, so people buy a lot of it. If people are going to buy so much, then it has to be cheap. |
| Truffles are more nutritious, and healthy food is always more expensive than unhealthy food. |
| People eat so much rice that an additional serving of rice has little marginal value, but the marginal value of another serving of truffles is very high. |

Using the data below, I need answers to the following questions:
a) Using the data in Table 1, specify a linear functional form for the demand for Combination 1 meals, and run a regression to estimate the demand for Combo 1meals.
b) Using statistical software (Excel), estimate the parameters of the empirical demand function specifiedin part a.Write your estimated industry demand equation.
c) Evaluate your regression results by examining signs of parameters, p-values, and the R2.
d) Discuss how the estimation of demand might beimproved.
e) If the owner plans to charge a price of 4.15 for a Combination 1 meal and spend $18,000 per week on advertising, how many Combination 1 meals do you predict will be sold each week?
f) If the owner spends $18,000 per week on advertising, write the equation for the inverse demand function. Then, calculate the demand price for 50,000 Combination meals.
Estimation and Analysis of Demand for Fast Food Meals
You work for PriceWatermanCoopers as a market analyst. PWC has been hired by the owner of two Burger King restaurants located in a suburban Atlanta market area to study the demand for its basic hamburger meal packageâreferred to as âCombination 1" on its menus. The two restaurants face competition in the Atlanta suburb from five other hamburger restaurants (three MacDonaldâs and two Wendyâs restaurants) and three other restaurants serving âdrive-throughâ fast food (a Taco Bell, a Kentucky Fried Chicken, and a small family-owned Chinese restaurant).
The owner of the two Burger King restaurants provides PWC with the data shown in Table 1. Q is the total number of Combination 1 meals sold at both locations during each week in 1998. P is the average price charged for a Combination 1 meal at the two locations. [Prices are identical at the two Burger King locations.] Every week the Burger King owner advertises special price offers at its two restaurants exclusively in daily newspaper advertisements. A is the dollar amount spent on newspaper ads for each week in 1998. The owner could not provide PWC with data on prices charged by other competing restaurants during 1998. For the one-year time period of the study, household income and population in the suburb did not change enough to warrant inclusion in the demand analysis.
TABLE 1: Weekly Sales Data for Combination 1 Meals (1998)
week Q P A week Q P A
| 1 | 51,345 | 2.78 | 4,280 | 27 | 78,953 | 2.27 | 21,225 |
| 2 | 50,337 | 2.35 | 3,875 | 28 | 52,875 | 3.78 | 7,580 |
| 3 | 86,732 | 3.22 | 12,360 | 29 | 81,263 | 3.95 | 4,175 |
| 4 | 118,117 | 1.85 | 19,250 | 30 | 67,260 | 3.52 | 4,365 |
| 5 | 48,024 | 2.65 | 6,450 | 31 | 83,323 | 3.45 | 12,250 |
| 6 | 97,375 | 2.95 | 8,750 | 32 | 68,322 | 3.92 | 11,850 |
| 7 | 75,751 | 2.86 | 9,600 | 33 | 71,925 | 4.05 | 14,360 |
| 8 | 78,797 | 3.35 | 9,600 | 34 | 29,372 | 4.01 | 9,540 |
| 9 | 59,856 | 3.45 | 9,600 | 35 | 21,710 | 3.68 | 7,250 |
| 10 | 23,696 | 3.25 | 6,250 | 36 | 37,833 | 3.62 | 4,280 |
| 11 | 61,385 | 3.21 | 4,780 | 37 | 41,154 | 3.57 | 13,800 |
| 12 | 63,750 | 3.02 | 6,770 | 38 | 50,925 | 3.65 | 15,300 |
| 13 | 60,996 | 3.16 | 6,325 | 39 | 57,657 | 3.89 | 5,250 |
| 14 | 84,276 | 2.95 | 9,655 | 40 | 52,036 | 3.86 | 7,650 |
| 15 | 54,222 | 2.65 | 10,450 | 41 | 58,677 | 3.95 | 6,650 |
| 16 | 58,131 | 3.24 | 9,750 | 42 | 73,902 | 3.91 | 9,850 |
| 17 | 55,398 | 3.55 | 11,500 | 43 | 55,327 | 3.88 | 8,350 |
| 18 | 69,943 | 3.75 | 8,975 | 44 | 16,262 | 4.12 | 10,250 |
| 19 | 79,785 | 3.85 | 8,975 | 45 | 38,348 | 3.94 | 16,450 |
| 20 | 38,892 | 3.76 | 6,755 | 46 | 29,810 | 4.15 | 13,200 |
| 21 | 43,240 | 3.65 | 5,500 | 47 | 69,613 | 4.12 | 14,600 |
| 22 | 52,078 | 3.58 | 4,365 | 48 | 45,822 | 4.16 | 13,250 |
| 23 | 11,321 | 3.78 | 9,525 | 49 | 43,207 | 4.00 | 18,450 |
| 24 | 73,113 | 3.75 | 18,600 | 50 | 81,998 | 3.93 | 16,500 |
| 25 | 79,988 | 3.22 | 14,450 | 51 | 46,756 | 3.89 | 6,500 |
| 26 | 98,311 | 3.42 | 15,500 | 52 | 34,592 | 3.83 | 5,650 |