1
answer
0
watching
309
views
27 Oct 2018
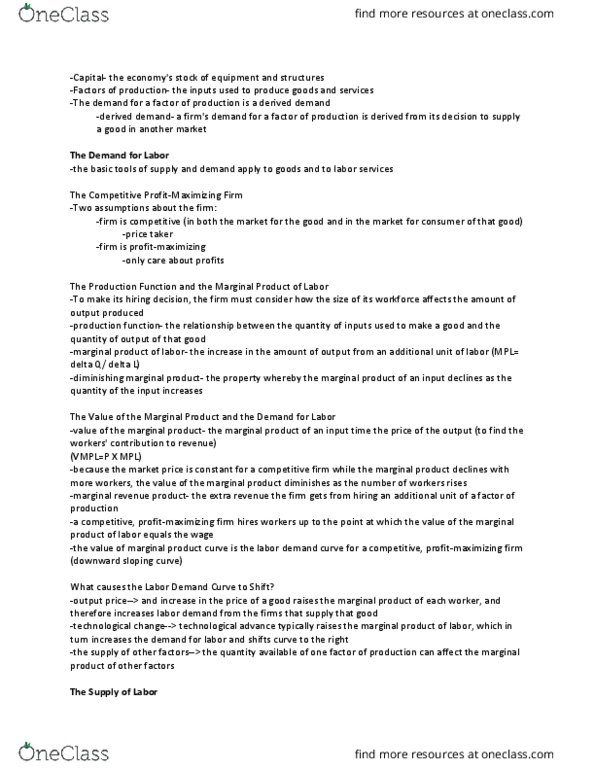
The diagram below shows the MRP curve for a firm producing copper plumbing pipe. The factor of production being considered here is hours of labour. $ 16 Dollars $ 12 MRP2 MRP 1 MRP3 80 100 120 140 160 180 Units of labour FIGURE 13-2 39) Refer to Figure 13-2. Suppose this firm initially has the marginal revenue product curve MRP). One reason that the curve could shift to MRP3 is A) an increase in demand for the firm's output, copper plumbing pipe. B) a decrease in the market price of copper plumbing pipe. C) a decrease in the supply of labour. D) an increase in the wage rate. E) an increase in the marginal product of labour.
The diagram below shows the MRP curve for a firm producing copper plumbing pipe. The factor of production being considered here is hours of labour. $ 16 Dollars $ 12 MRP2 MRP 1 MRP3 80 100 120 140 160 180 Units of labour FIGURE 13-2 39) Refer to Figure 13-2. Suppose this firm initially has the marginal revenue product curve MRP). One reason that the curve could shift to MRP3 is A) an increase in demand for the firm's output, copper plumbing pipe. B) a decrease in the market price of copper plumbing pipe. C) a decrease in the supply of labour. D) an increase in the wage rate. E) an increase in the marginal product of labour.

Irving HeathcoteLv2
29 Oct 2018
Related textbook solutions


Related questions
|
|||||||||||||||||||||||||||||||||||||||||||||||||||||||||||||||||||||||||||||||||||||||||||||||||||||||||||||||||||||||||||||||||||||||||||||||||||||||||||||||||||||||||||||||||||||||||||||||||||||||||||||||||||||||||||||||||||||||||||||||||||||||||||||||||||||||||||||||||||||||||||||||||||||||||||||||||||||||||||||||||||||||||||||||||||||||||||||||||||||||||||||||||||||||||||||||||||||||||||||||||||||||||||||||||||||
|
|