MIS 111 Lecture 25: Class 23 - Module 2 Technology Data Visualization

16 Oct 2018
School
Department
Course
Professor
MIS 111 verified notes
25/47View all
Document Summary
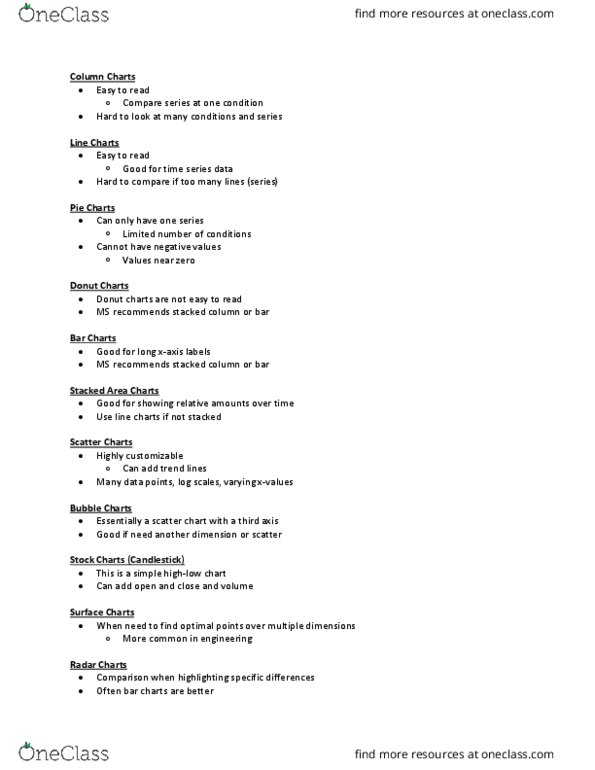
Column charts: easy to read, compare series at one condition, hard to look at many conditions and series. Line charts: easy to read, good for time series data, hard to compare if too many lines (series) Pie charts: can only have one series, limited number of conditions, cannot have negative values, values near zero. Donut charts: donut charts are not easy to read, ms recommends stacked column or bar. Bar charts: good for long x-axis labels, ms recommends stacked column or bar. Stacked area charts: good for showing relative amounts over time, use line charts if not stacked. Scatter charts: highly customizable, can add trend lines, many data points, log scales, varying x-values. Bubble charts: essentially a scatter chart with a third axis, good if need another dimension or scatter. Stock charts (candlestick: this is a simple high-low chart, can add open and close and volume.