01:198:110 Lecture Notes - Lecture 27: Pie Chart, Pivot Table

5 Dec 2018
School
Department
Course
Professor
01:198:110 verified notes
27/28View all

Document Summary
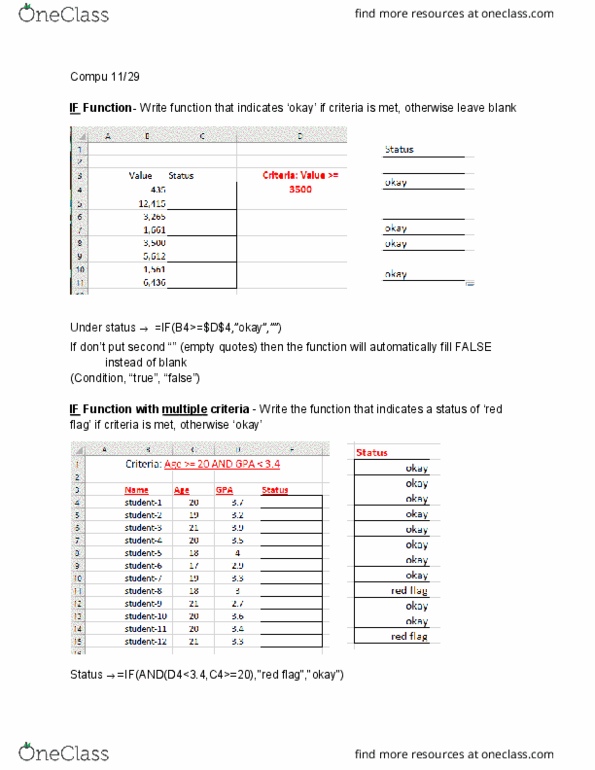
Pie chart: the circle of pie charts represents 100%. The circle is subdivided into slices representing data values. The size of each slice shows what part of the. Column chart: bar graph or column chart" as they are known in excel are most often used to show amounts or the number of times a value occurs. The amounts are displayed using a vertical bar or rectangle. The taller the column, the greater number of times the value occurs. Column charts make it easy to see the difference in the data being compared. Pivot tables (pivot - to turn) - manipulate the data you have so that it is useful to you. Row class, column gender, class in value, filter to only wednesday. When only have two values, most of the time the row can also be value. Benjamin would be 1 in descending if based off of home state (simply because he is already above ellen)