PH-UY 1013 Lecture Notes - Lecture 2: Resultant Force, Net Force, Friction

Document Summary
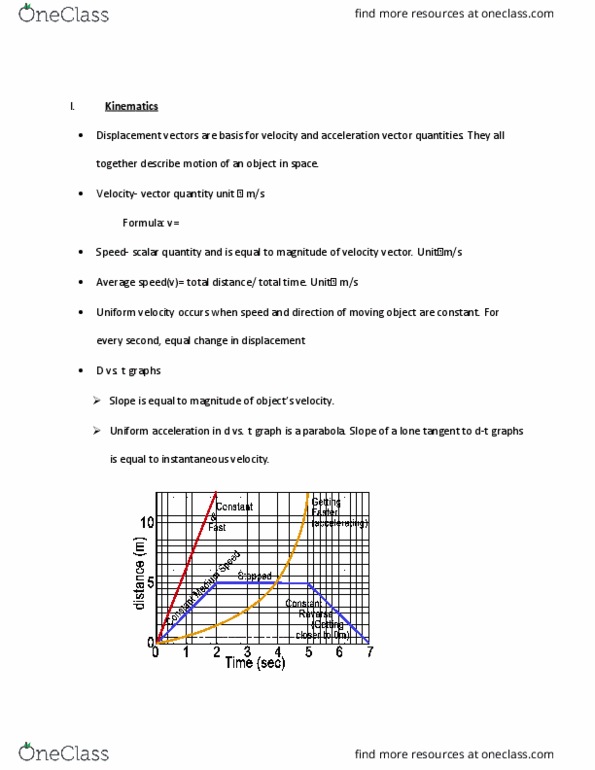
Position, velocity, or acceleration may be plotted against time. Time will be on the x axis, the other value will be on the y axis. Be able to find change in a given value over an interval in the other. The slope of the position vs time graph is velocity. The area under the velocity vs time graph is displacement. An average slope over a time interval corresponds to an average velocity. A slope at a point (such as in a tangent line) corresponds to an instantaneous velocity. The slope of the velocity vs time graph is acceleration. If acceleration is constant, the graph of velocity vs time will be a straight line with constant slope, and the graph of position vs time will be a parabola. The area under acceleration vs time is change in velocity: gravity. Ignore air resistance, wind resistance, or drag force. Acceleration due to gravity, or g, is 9. 81 m/s2 in the downwards direction.